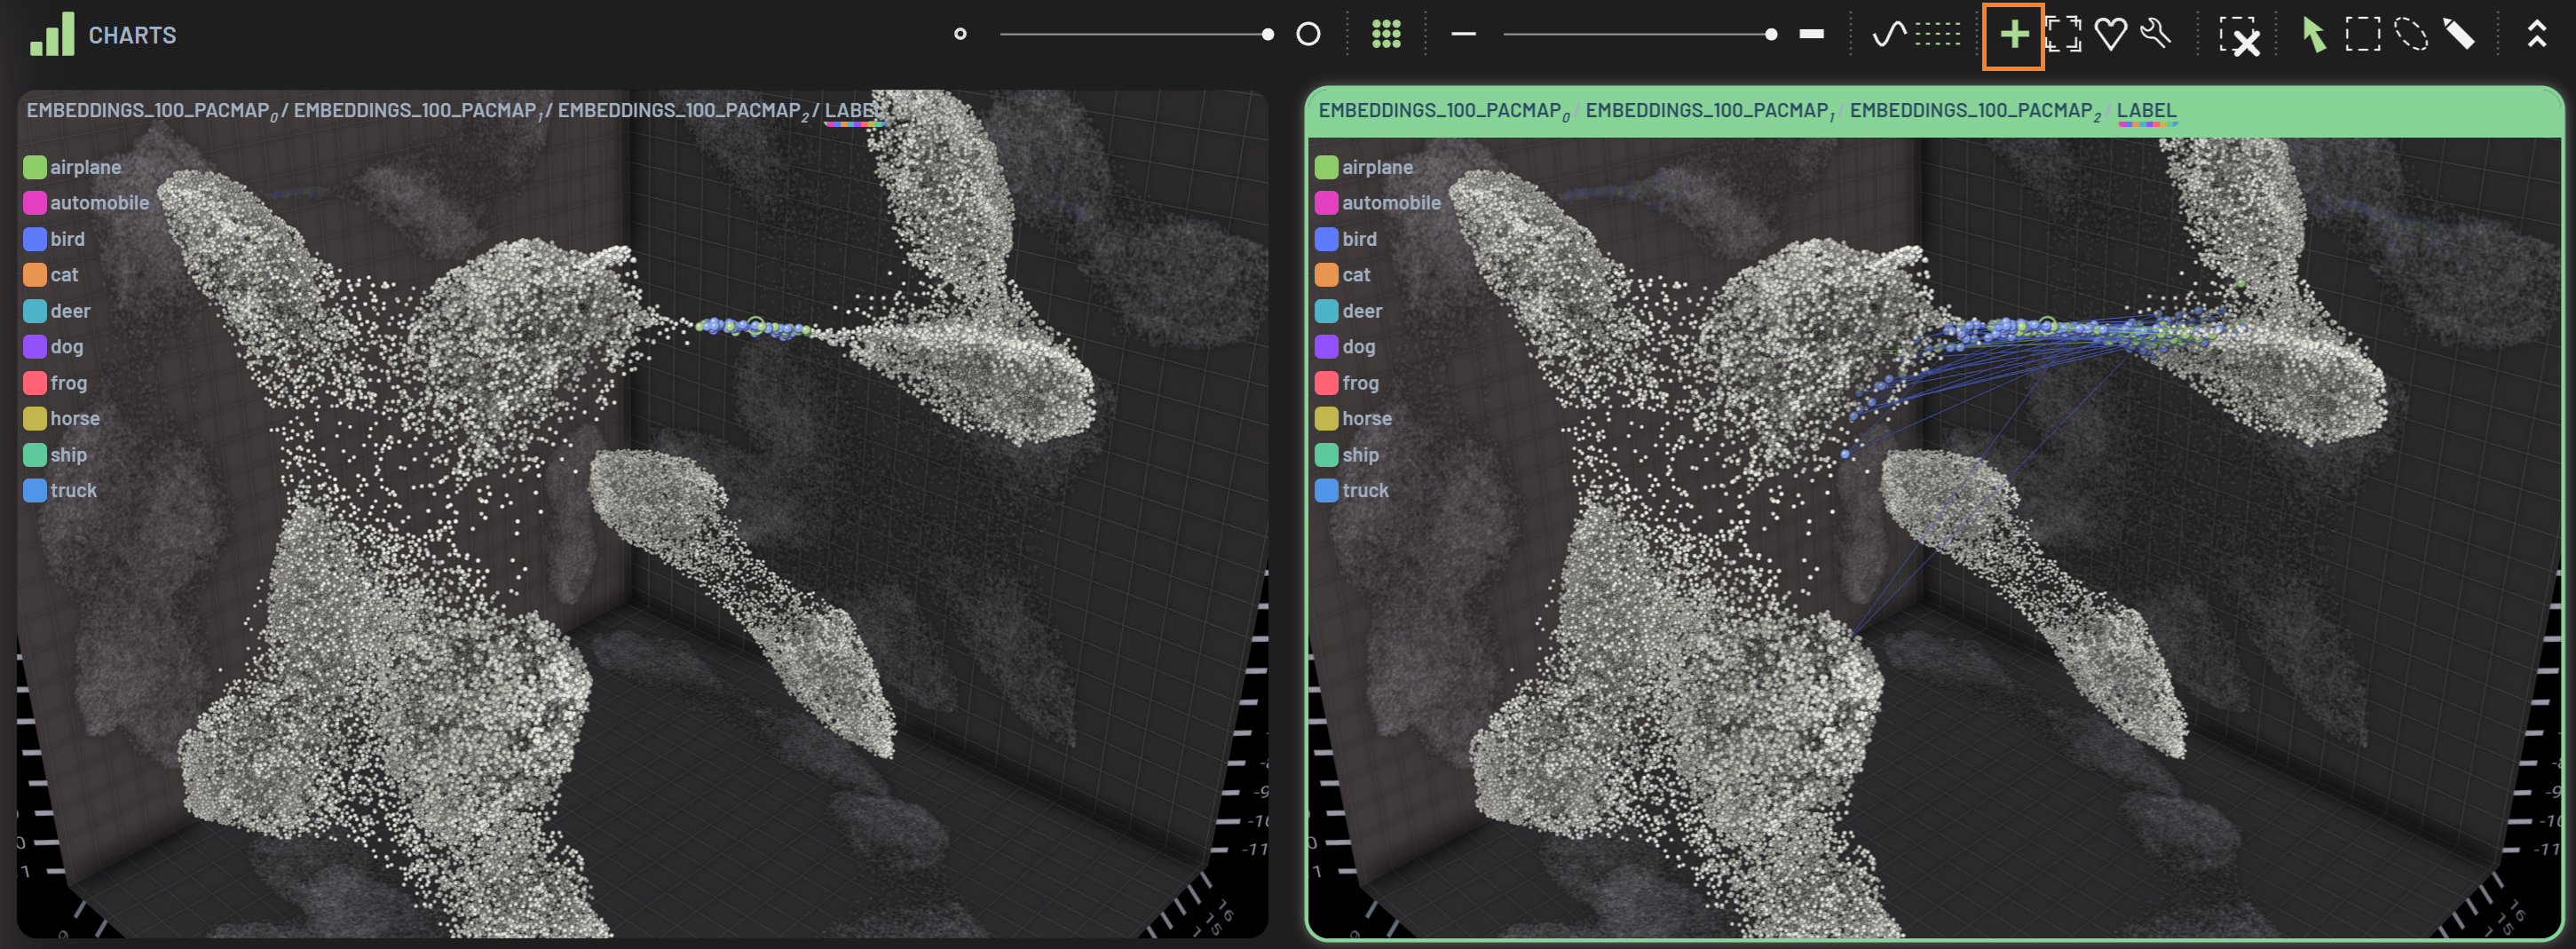
How to show partially filtered-in samples across epochs
Imagine a scenario where you filtered some data points of interest using the filters and/or polygon selections and then
you want to look at how these filtered-in samples evolve across all epochs. You can use the chart tool
show partially filtered-in samples across epochs in the Charts Toolbar to expand these
filtered-in samples to all epochs. Turning on the connecting lines enables you to see the evolving path for a given sample.

Warning
Unlike other operations, such as switching to polygon selection, this operation applies only to the selected chart. It is also a visual-only enhancement limited to that specific chart that does not change the global filter state, which means those data points are not reflected in the Metrics panel or in other charts, and you cannot do further data manipulation (e.g. filtering) on those additional data points.