How to create a BB/mask and image overlay chart
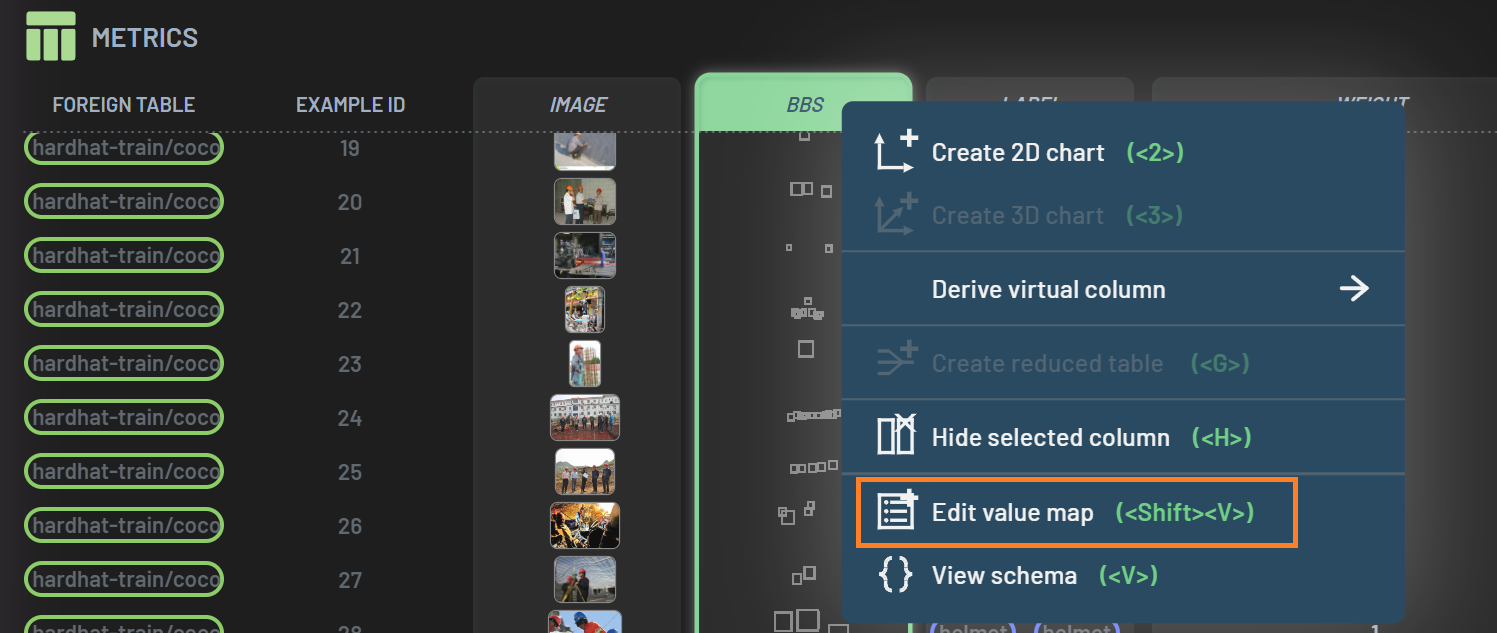
The difference between creating an image chart and creating a BB-image overlay chart is to select both the image and BBS columns and create a 2D chart by pressing 2. To overlay both ground truth BBs and predicted BBs, you just need to select the three columns image, BBS and BBSpredicted and create a 2D chart. You can plot the BBs by only selecting the BBS or BBSpredicted column. In the Dashboard, solid rectangle outlines represent ground truth BBs while dashed rectangle outlines represent predicted BBs.

Similarly, to create a mask-image overlay chart, select both image and mask (or segmentations) columns and create a 2D chart by pressing 2.
