3LC Dashboard Version 2.6
2.6.9
Enhancements and Fixes
[15942] Made a fix to respect schema default values when unpacking scalar array values
2.6.8
Features
[14126] Added NMS workflow that uses NMS to filter overlapping labels and retain the highest-confidence instance
[15344] Added a setting that will optionally ensure non-zero ‘weight’ after editing/assigning an instance such as a bounding box (default = False. Keyboard shortcut: Ctrl+Shift+F)
[15481] Added a setting to allow for user-defined zoom level when snapping to bounding boxes. The default behavior is unchanged (100), but it is now possible to tweak the margin on the GUI settings screen.
Enhancements and Fixes
[15431, 15222, 15223, 15224] Avoid several potential null dereferences that can lead to crashes
[15432] Fixed an issue where use of the bin operation could inadvertently get into a recursive infinite loop
[15141] Added option for showing/hiding grid line overlays on images/bounding boxes (default = False. Keyboard shortcut: Ctrl+Shift+I) and charts (default = True. Keyboard shortcut: Ctrl+Shift+J)
[15430] Fixed an issue where double-clicking an editable cell would sometimes unselect all rows when filters applied
[14134] Fixed a long-standing glitch where opening the last Project (or specifying one as a query parameter) would not always open the Runs or Tables tab (because that data was not yet received from the backend)
[15489] When finding fallback selected elements, auto-scroll Table view to newly selected element
[15490] Allow for matching against the same box multiple times for matched ground truth and matched prediction IOUs operations
[15514] Fixed styling and placement of feedback form
[15516] Fixed an issue where IOU was incorrect when both ground truth IOU and prediction IOU were derived
[15533] Fixed alignment of icon for opening docs in a new tab
[15536] Fixed a couple of glitches when collapsing Workflow Annotation dialog
[14600] Made it so that workflows requiring multiple epochs are not enabled if only one epoch of metrics is collected
2.6.7
Features
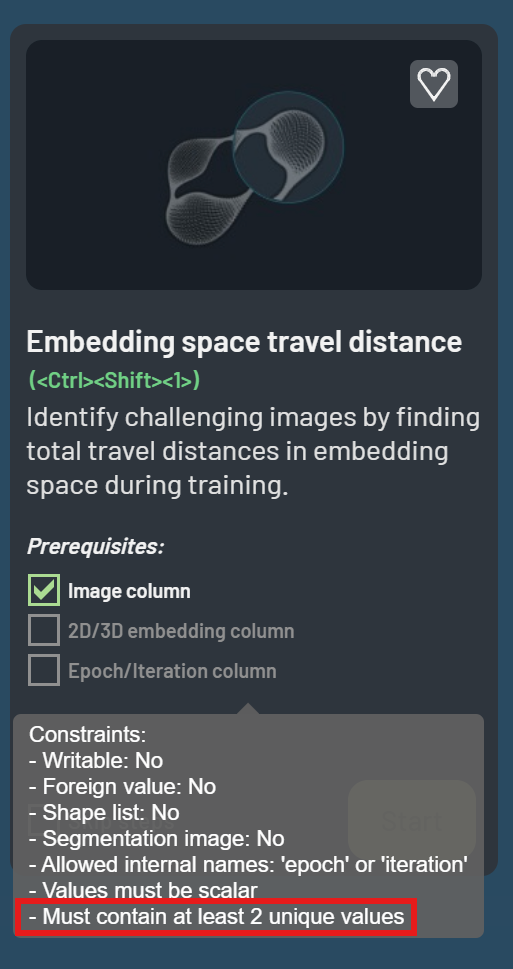
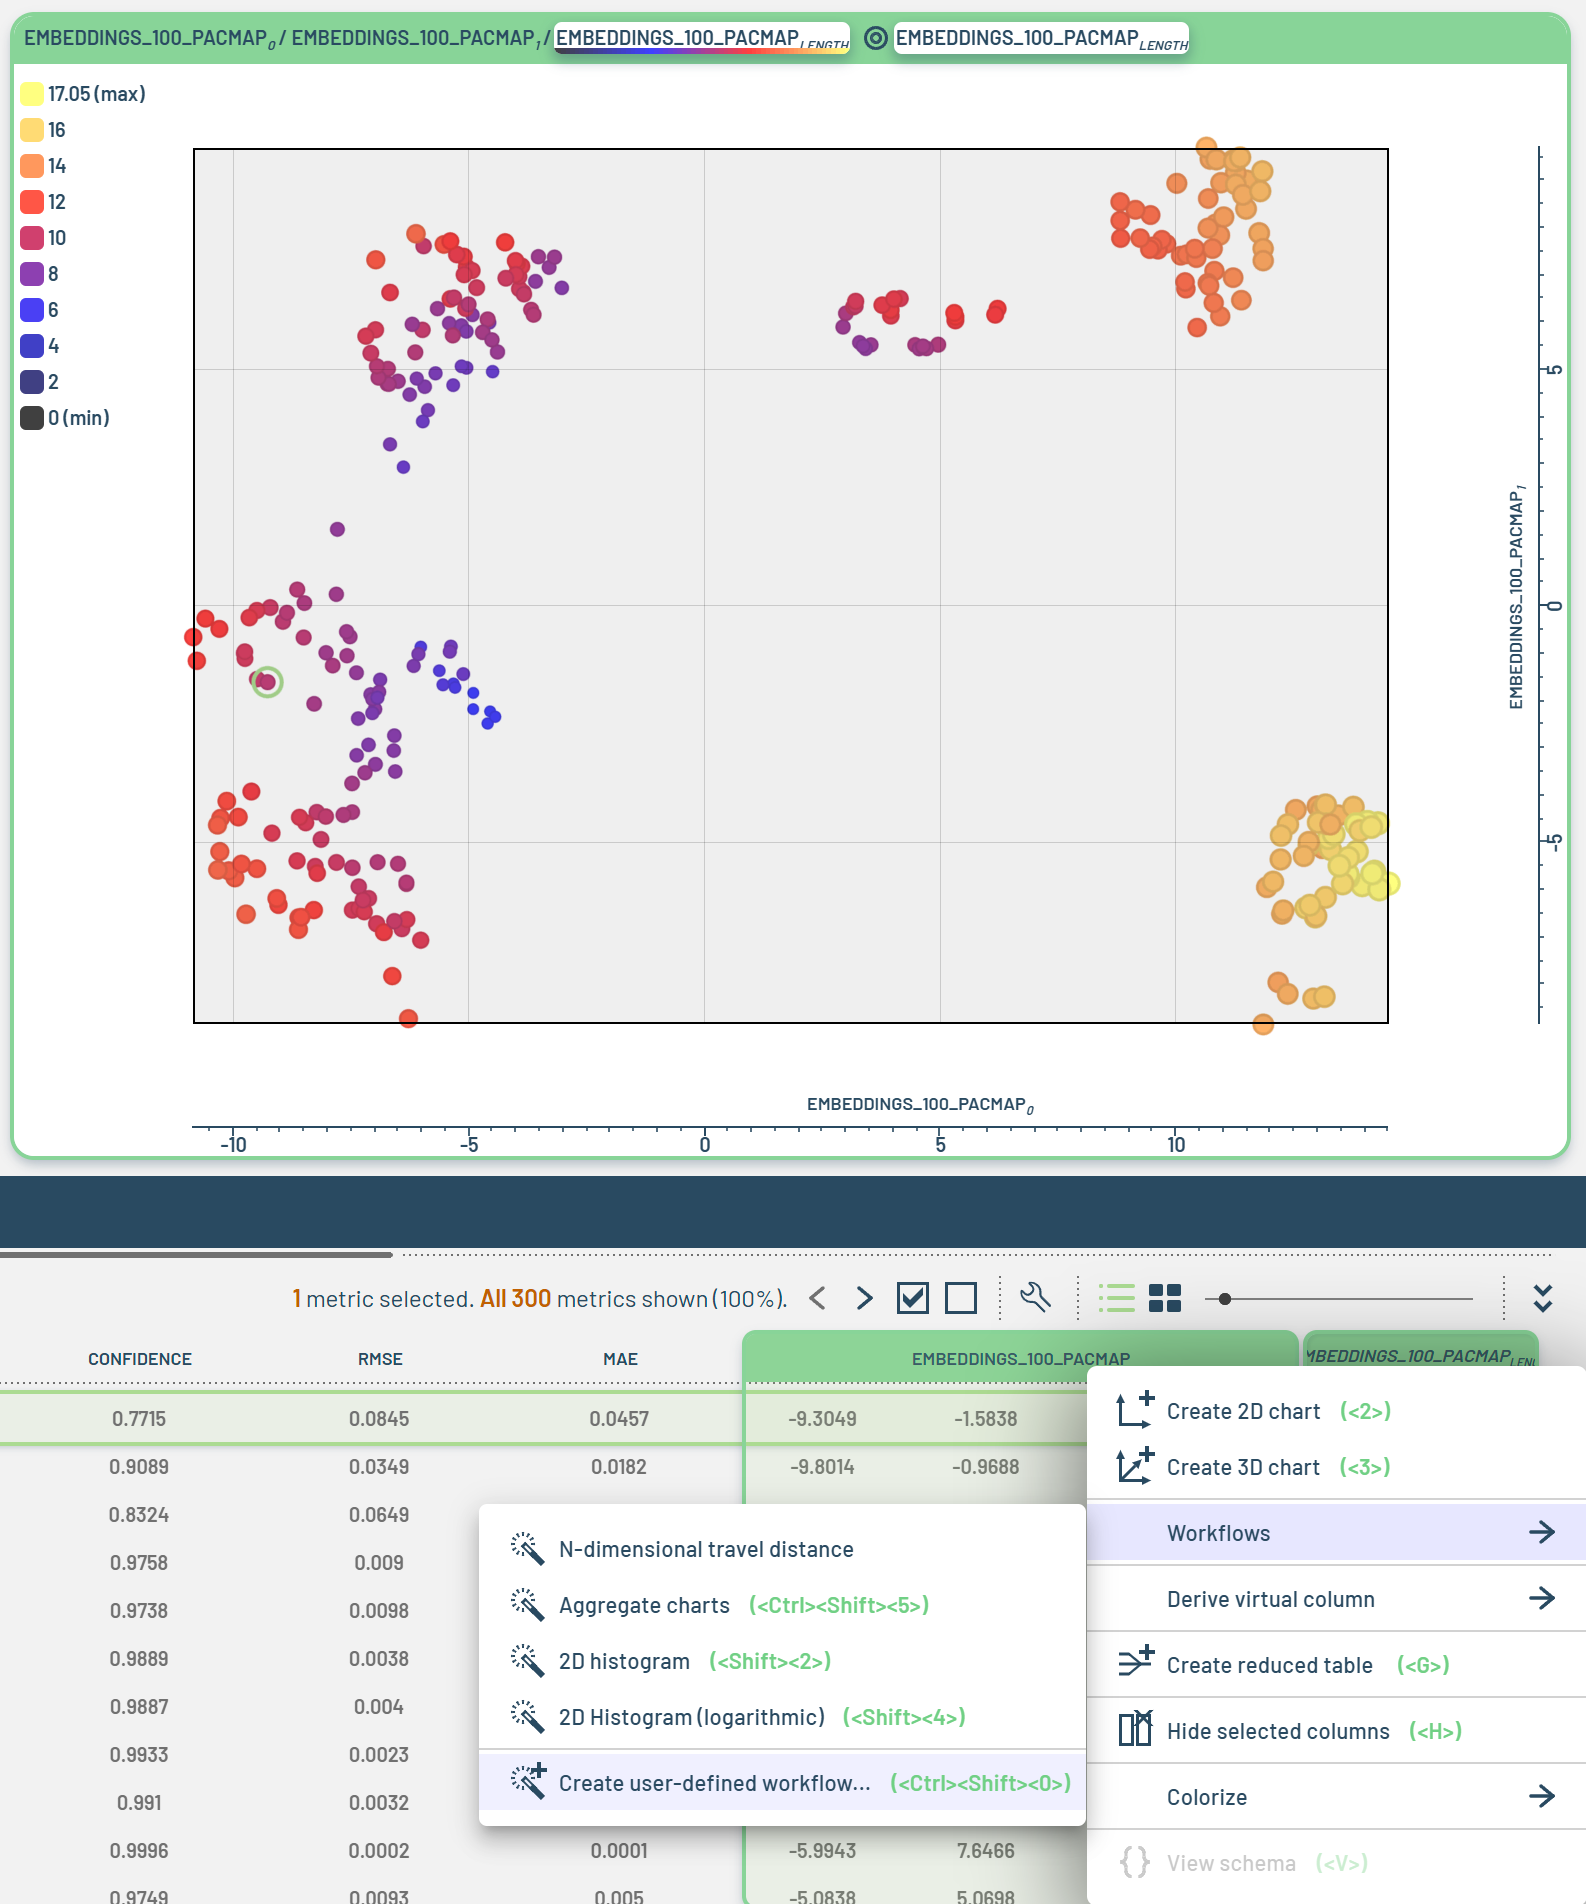
[15041] Added support for creating and persisting user-defined workflows, which are serialized with user settings
These user-defined workflows capture the state of selected elements at the time they are created
Selected charts will be regenerated
Selected virtual columns will be regenerated
Selected pinned properties (on the navigator bar) will be regenerated
Filter setup (range, enum or string) on selected columns will be restored
Sort order on selected columns will be restored
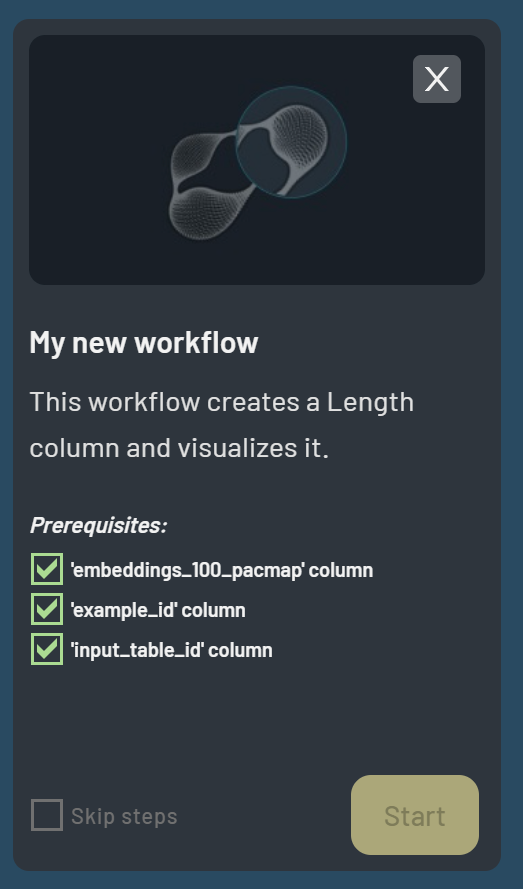
After creating a user-defined workflow, the title and description can be edited in the Workflows window, and it can be deleted by clicking the ‘x’ icon
Enhancements and Fixes
[15252] Fixed an issue where the workflow menu was not available when the “Run” column was selected
[15108] Fixed clipping of first and last histogram chart bars
[15256] Fixed an issue with display of some histograms
[15285] Fixed a bug where running the histogram workflow would automatically show several hidden columns
Fixed a long-standing bug where 2D/3D cameras would be temporarily unresponsive (for a second or so) until 3D camera interpolation in other windows finished
[14148] Improved user experience for sub-menus by only generating items when needed instead of all at once
[15286] Fixed issue where segmentation island count did not have a full menu of chained operations
[15341] When navigating through next/previous array elements, take filtered table sort order into account
2.6.6
Features
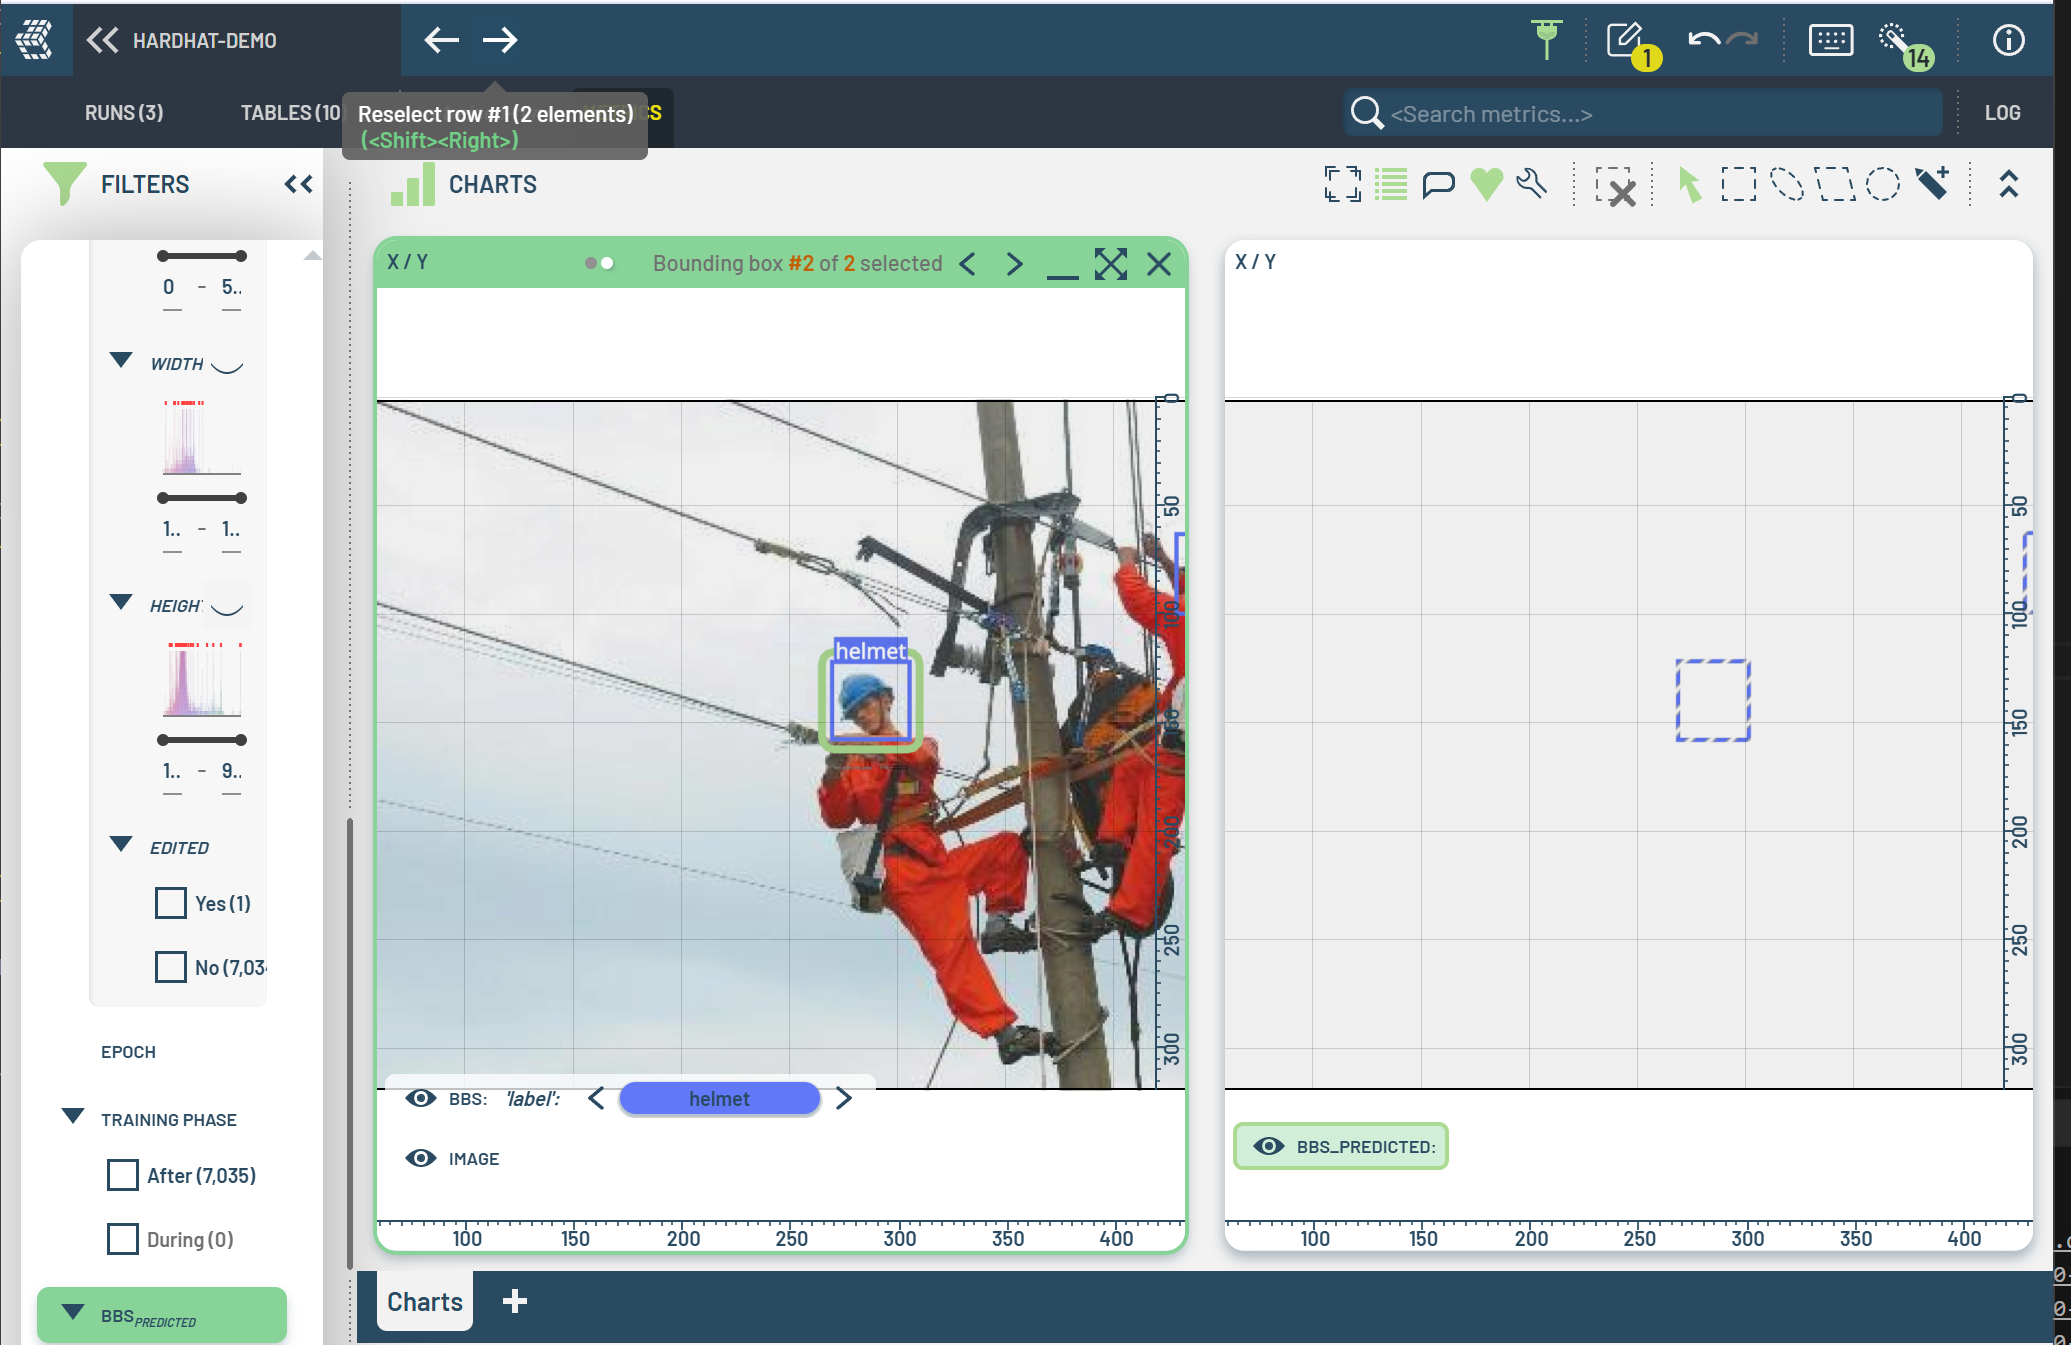
Added functionality for select Previous/Next (i.e. effectively unlimited undo/redo of selection state). Available on the main toolbar, or using Shift+Left and Shift+Right.
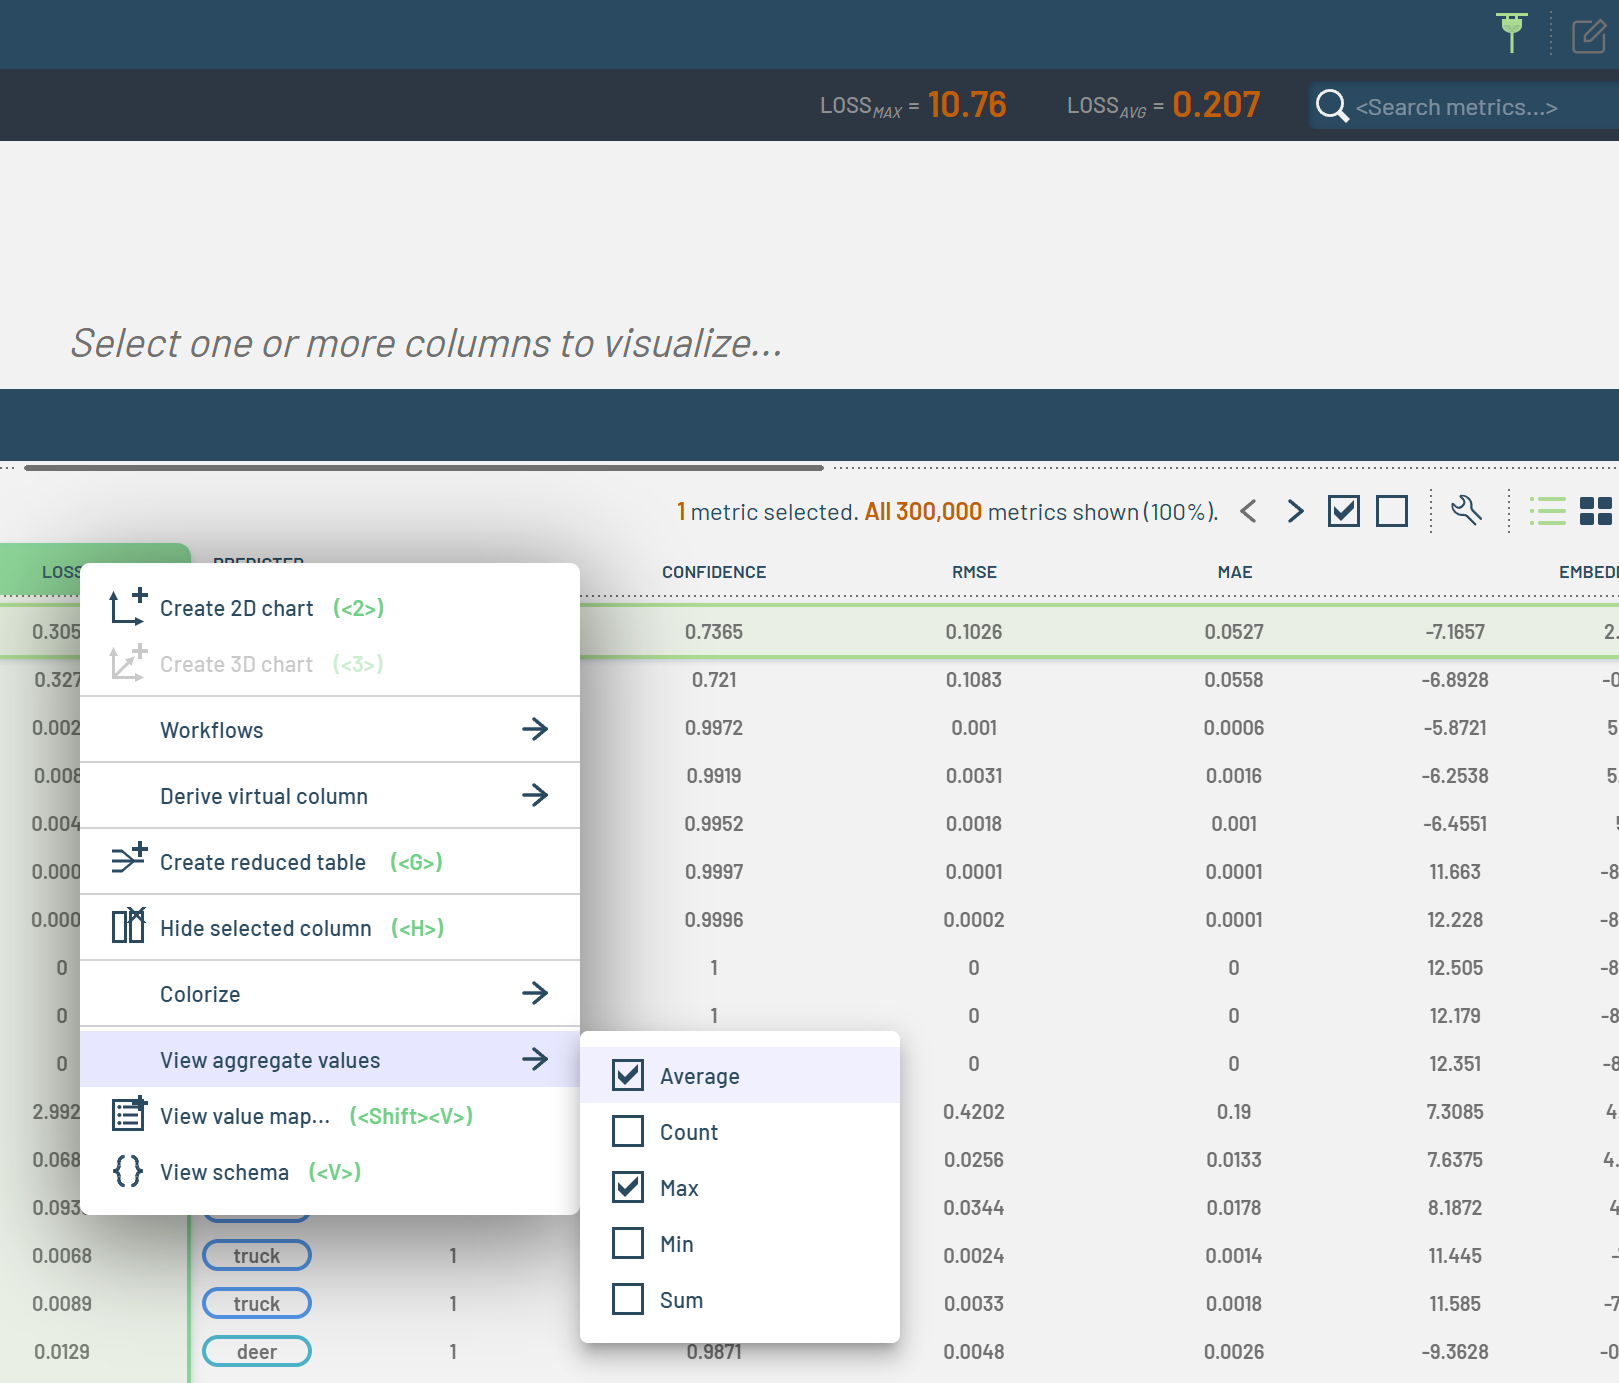
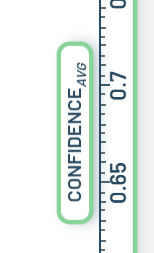
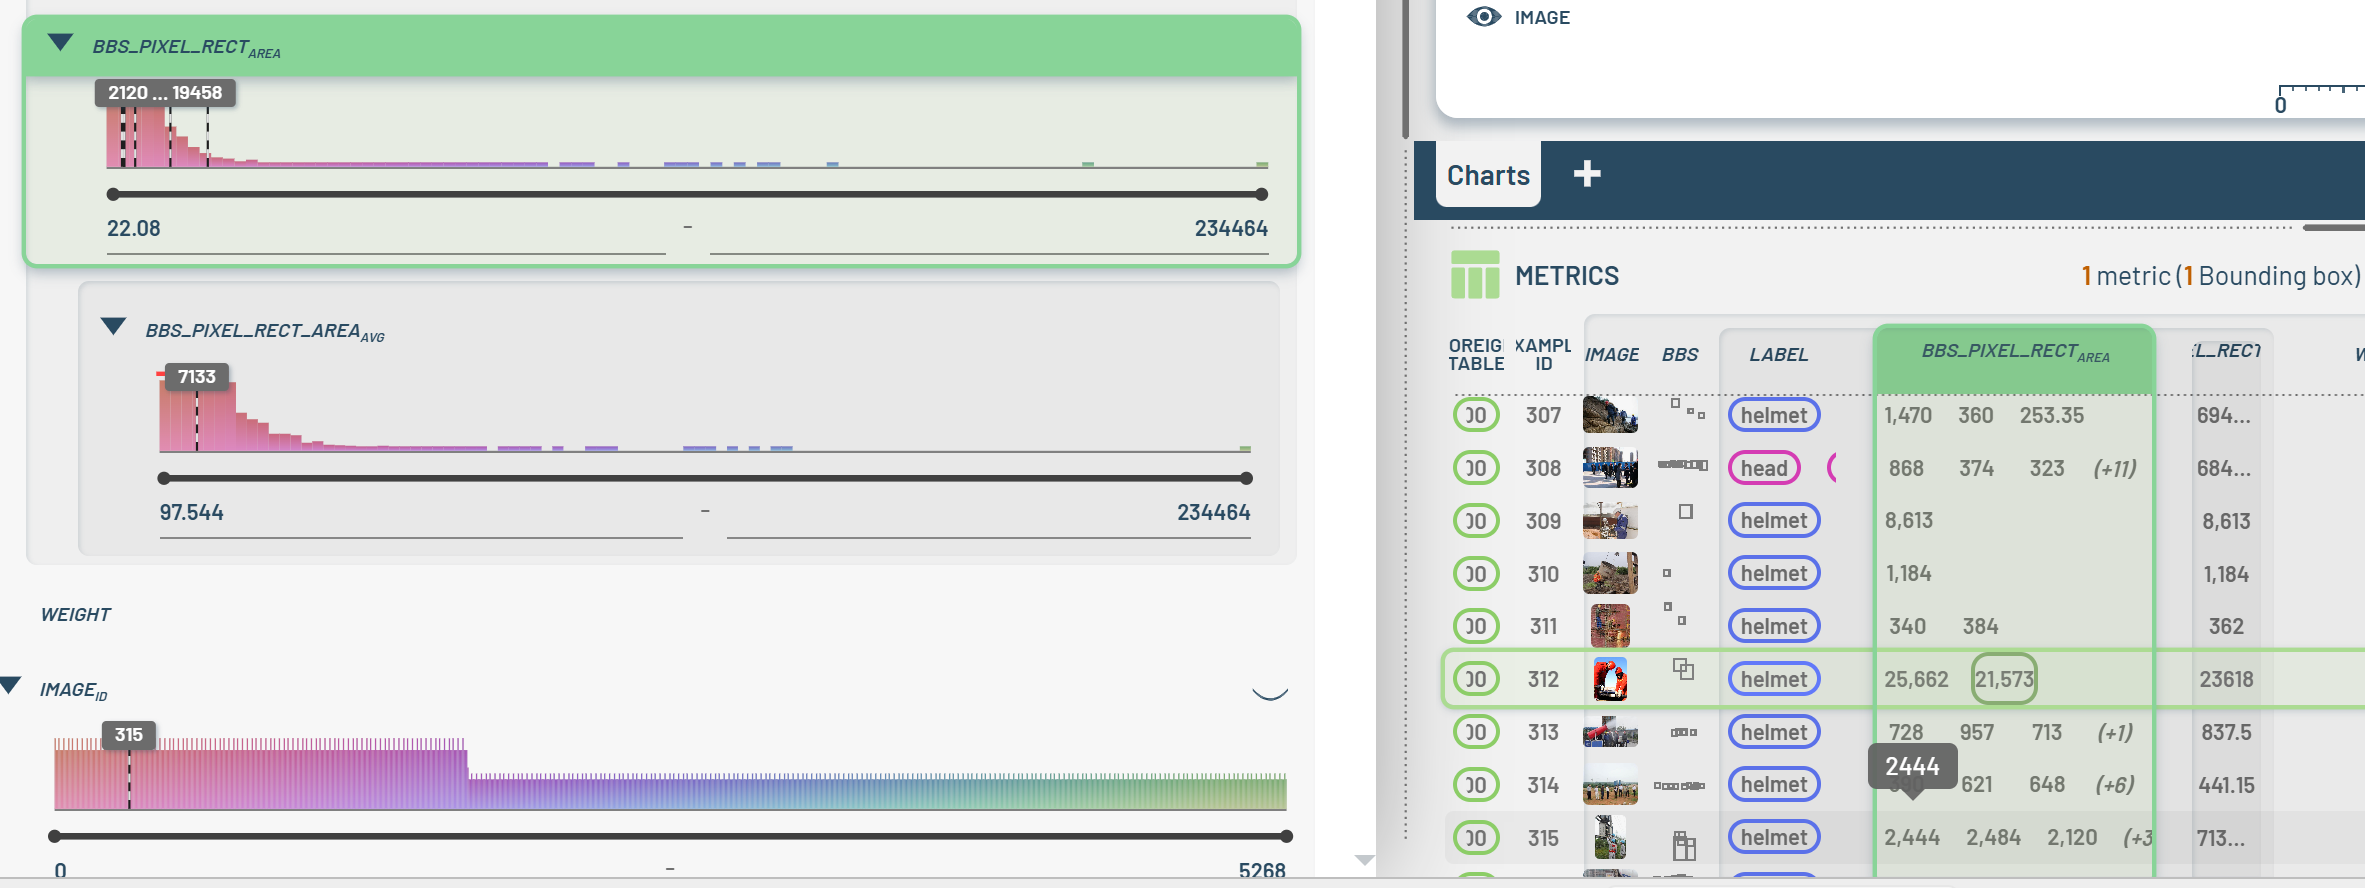
[15142] Added functionality for calculating aggregated values across table rows, and showing these on the Navigator bar. These ‘pinned’ aggregates will show up automatically the next time Runs or Tables are loaded with the same columns available. They can be removed by clicking the X to the right of the number.
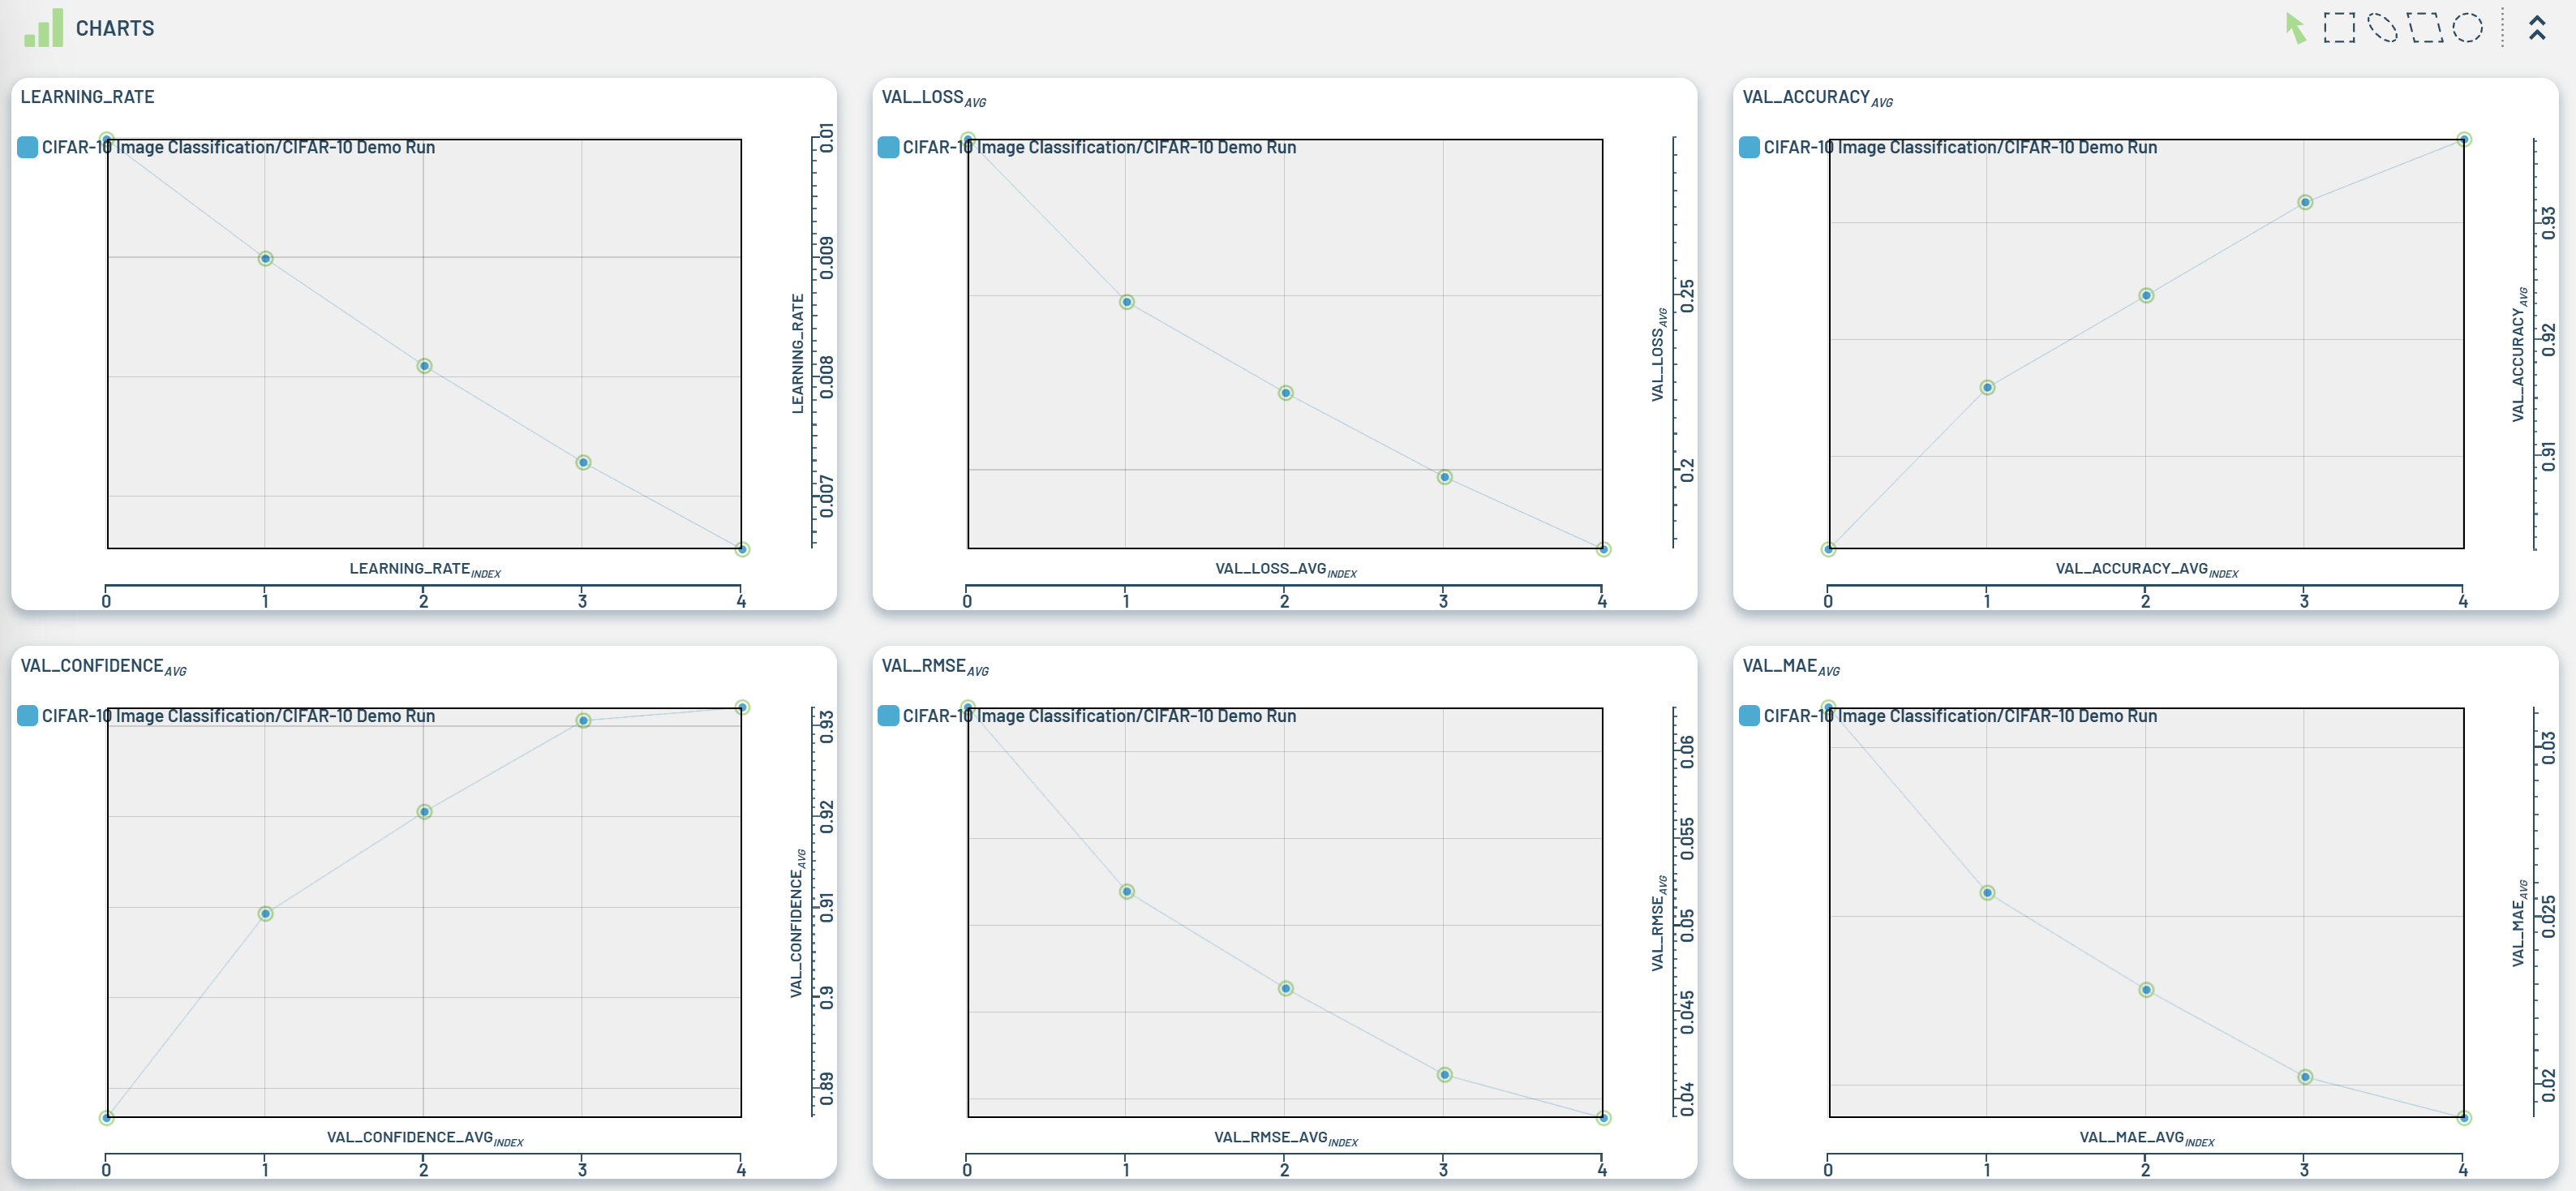
[15077, 15192] On 2D charts, show the names of the X/Y axis along the rulers, and make them behave like property headings within the chart title bar when it comes to highlight-on-hover, show column selection, and drag from/drag to
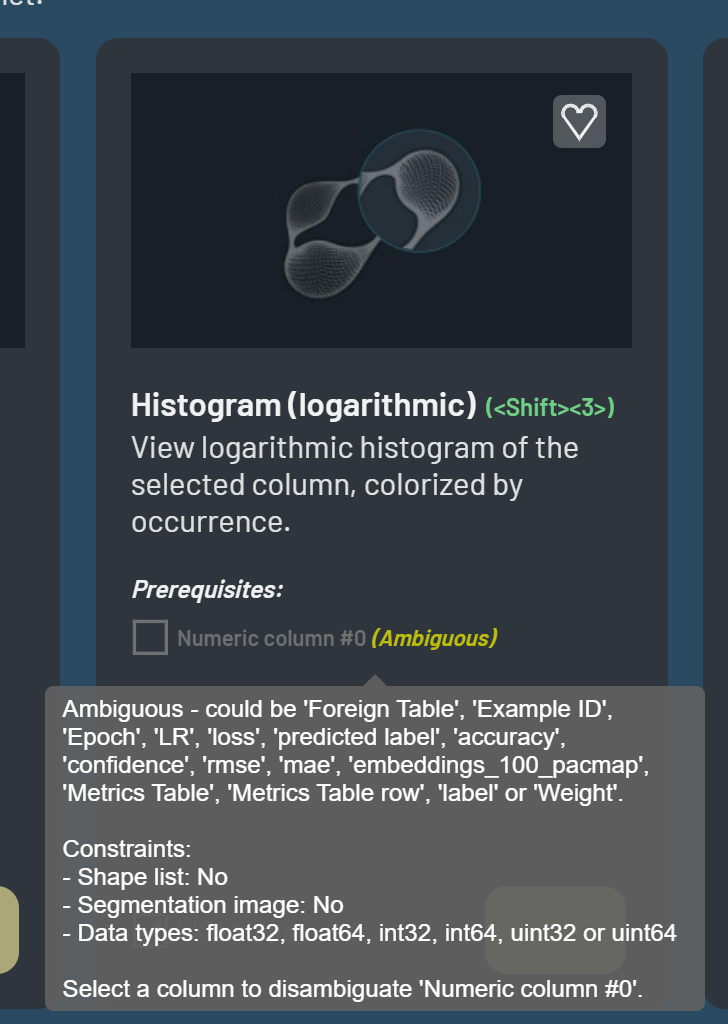
In the Workflows window, show constraints and explain ambiguities in column bindings
[15205] Slider widget: Show hovered-over values from arrays (similar to from scalar values). This applies when hovering over a table row with an array column.
[14907] Added an action for clearing the “Visited” column
Enhancements and Fixes
[14843] Support ‘,’ (comma) in value map internal names
[14899] Fixed array property display to use all available horizontal space
[15167] Fixed an issue where BB label editing was buggy when two enum columns existed inside a bb column
[15141] Do not show subpixel coordinates on image displays
[15140] Fixed a bug where “Occurrence” did not work with jagged array column and single value column together
[15116] Do not re-enable Live filters when selecting another table row
[15069] Show table type, row cache file, and cache populated in the TableIndexingTable rows
[15201] Made it so that the Show/Hide button in the filter table affects all selected columns
[11180] Made it so that when filtered-out points are hidden, selection is only allowed from visible points
[14942] Name metric tabs from stream name (when possible)
[15204] Made it so that tooltips are sized to fit their contents rather than being allocated a large fixed width
[15222] Fixed a long-standing bug where colorizing charts from strings did not work correctly
[15034] Made it so that workflows do not generate a chart if it already exists
[15164] Avoid an error in the unlikely event that the battery object is not as expected
[15221] Fixed lag when moving between sibling menus
[14901] Highlight hovered-over line in live tooltip components
2.6.5
Enhancements and Fixes
[15029] Fixed an issue where the Dashboard would fail to refresh its ID token and get an error about insufficient credits back from Object Service requests
[15100] Make it so tooltip indicates why button for deleting a value map item is sometimes disabled (e.g. “value map entry is in use”)
[15096] Fixed an issue causing a panel to not always update correctly
[15110] When getting back a 403 unauthenticated response from the Object Service, if the reason is due to time skew, provide details in the red error banner that shows at the top. This can happen when using the 3LC Enterprise Customer Managed deployment.
2.6.4
Features
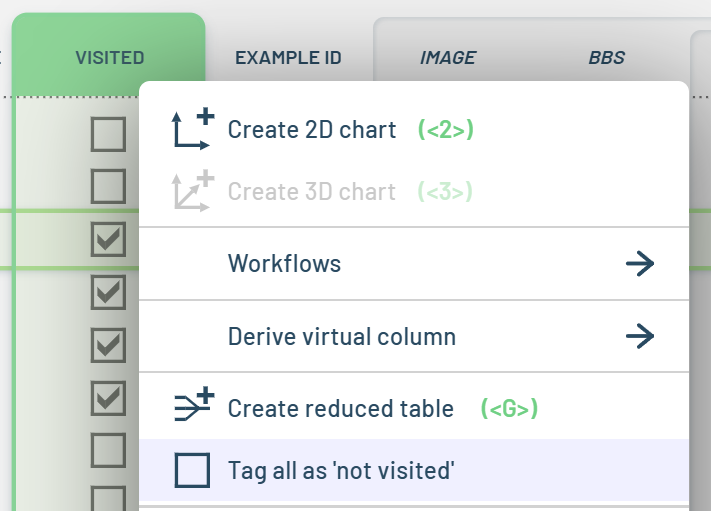
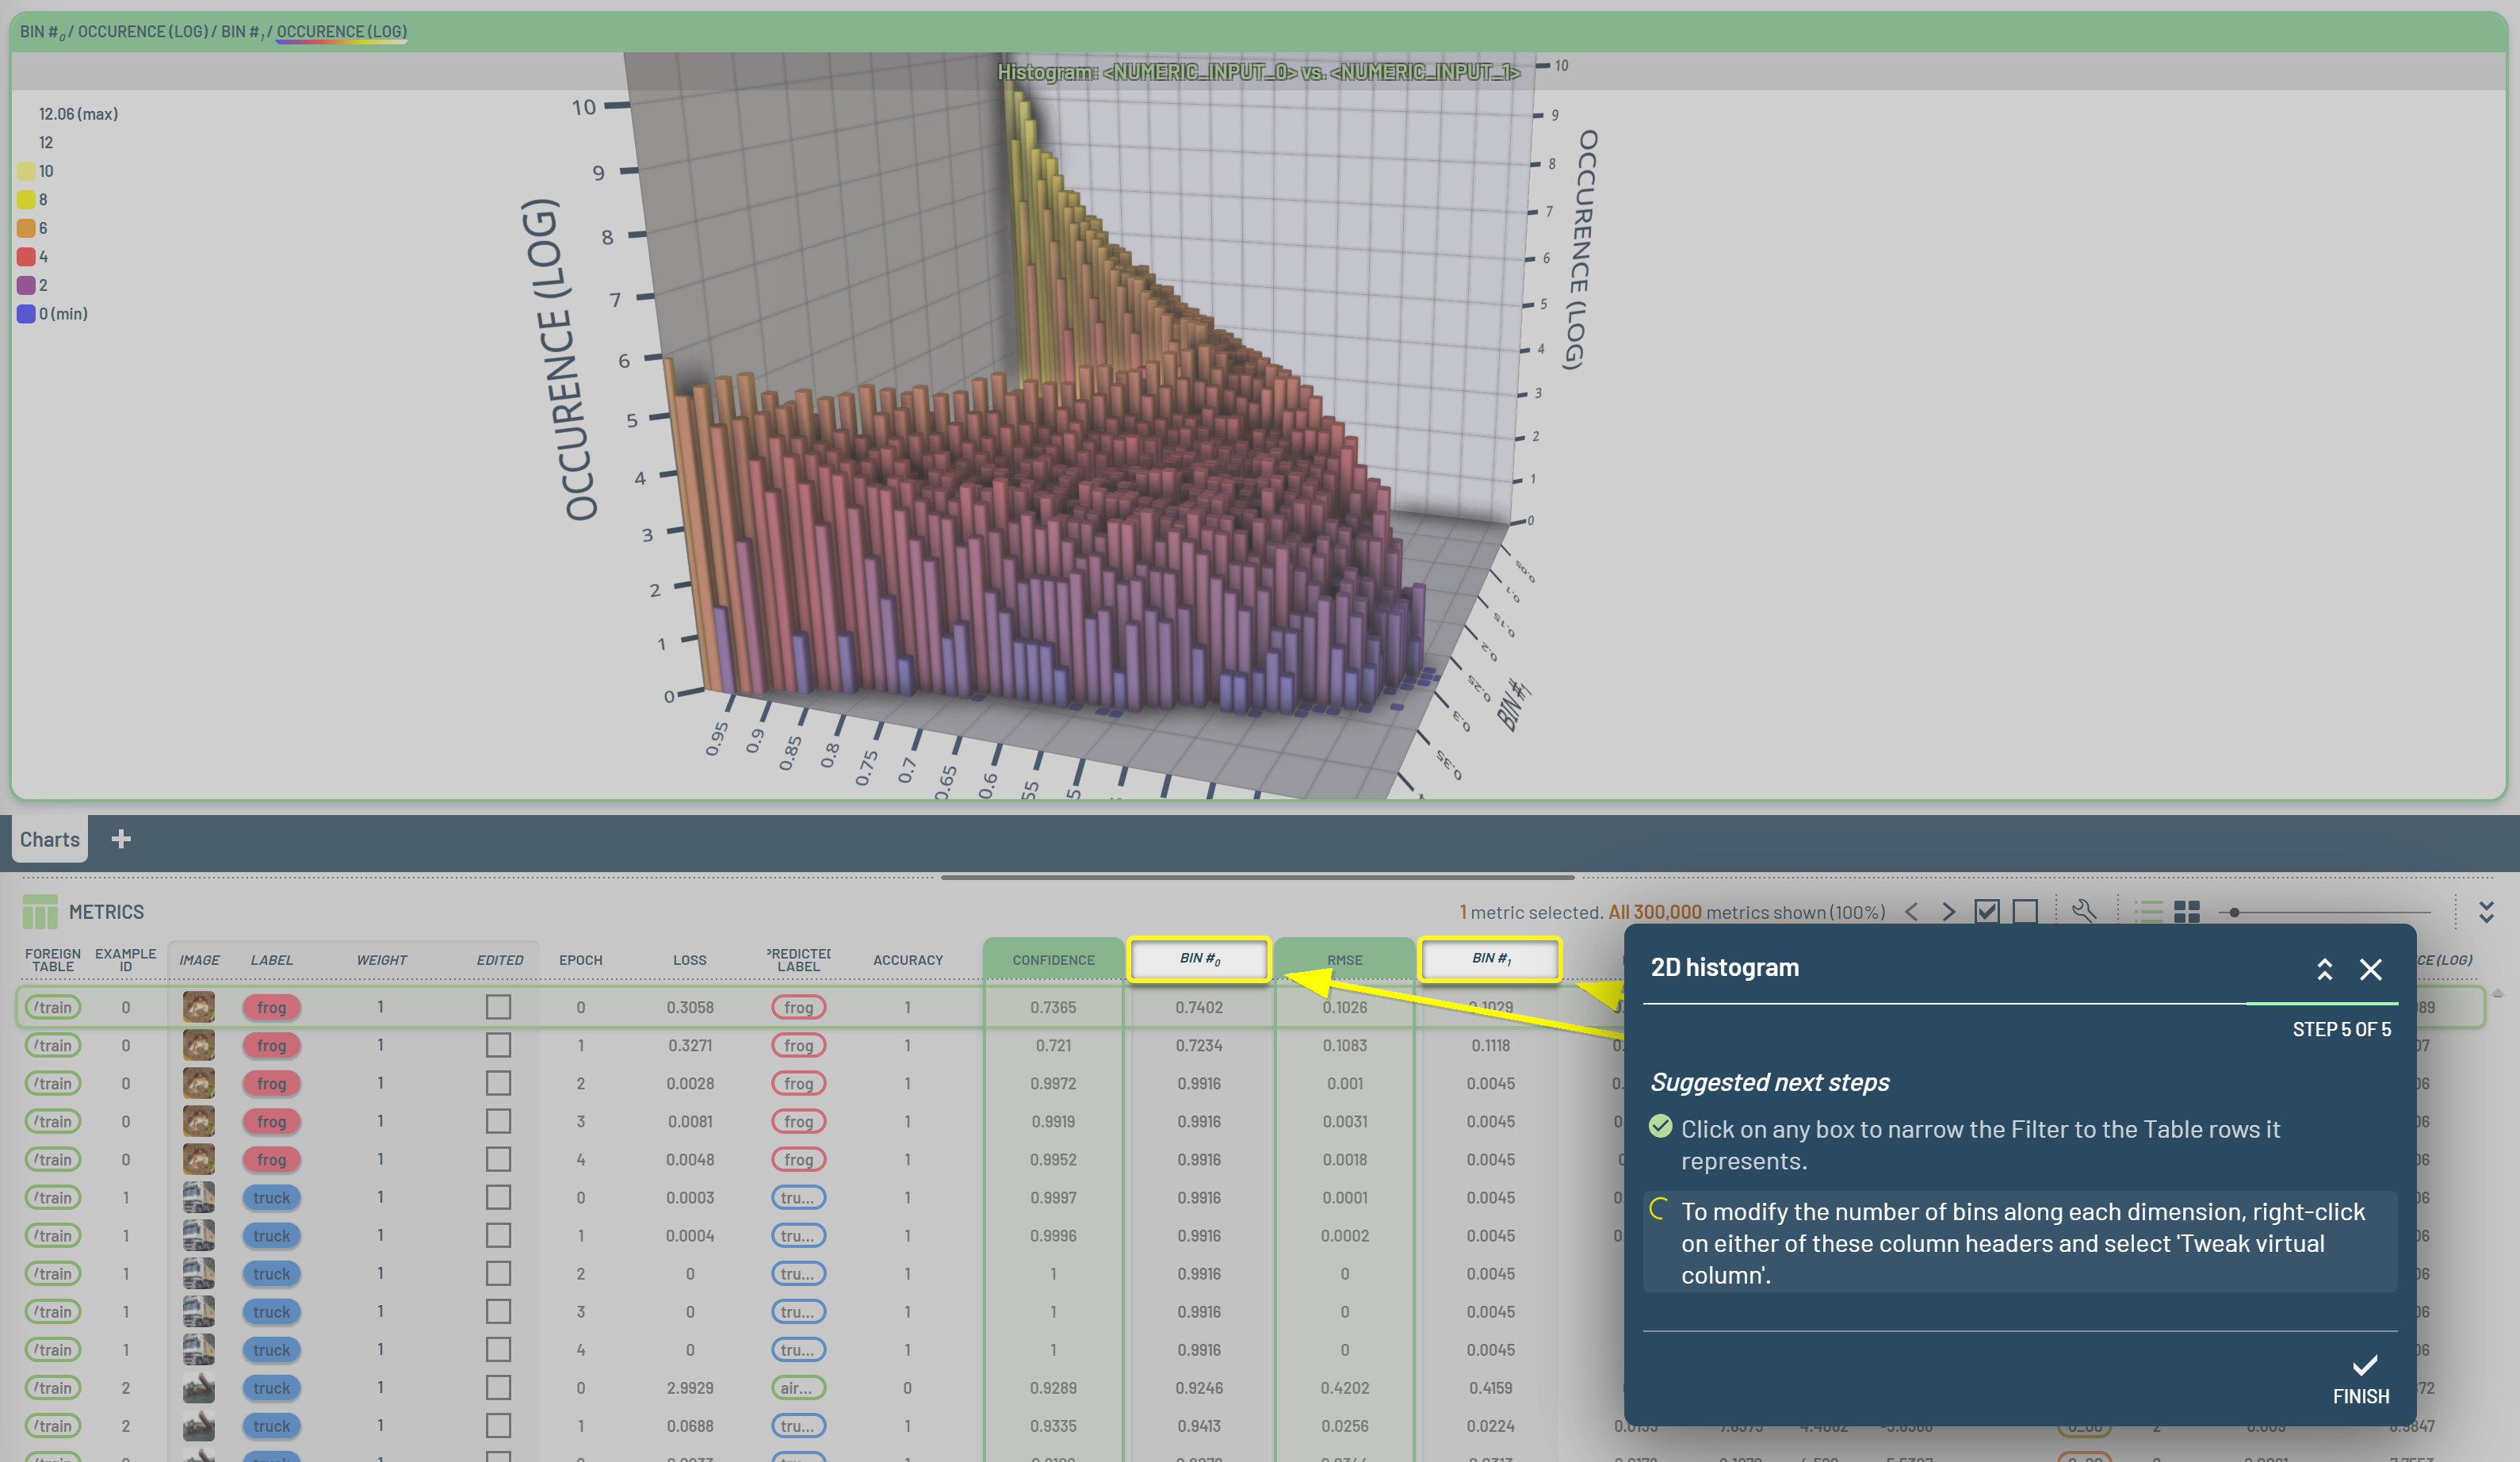
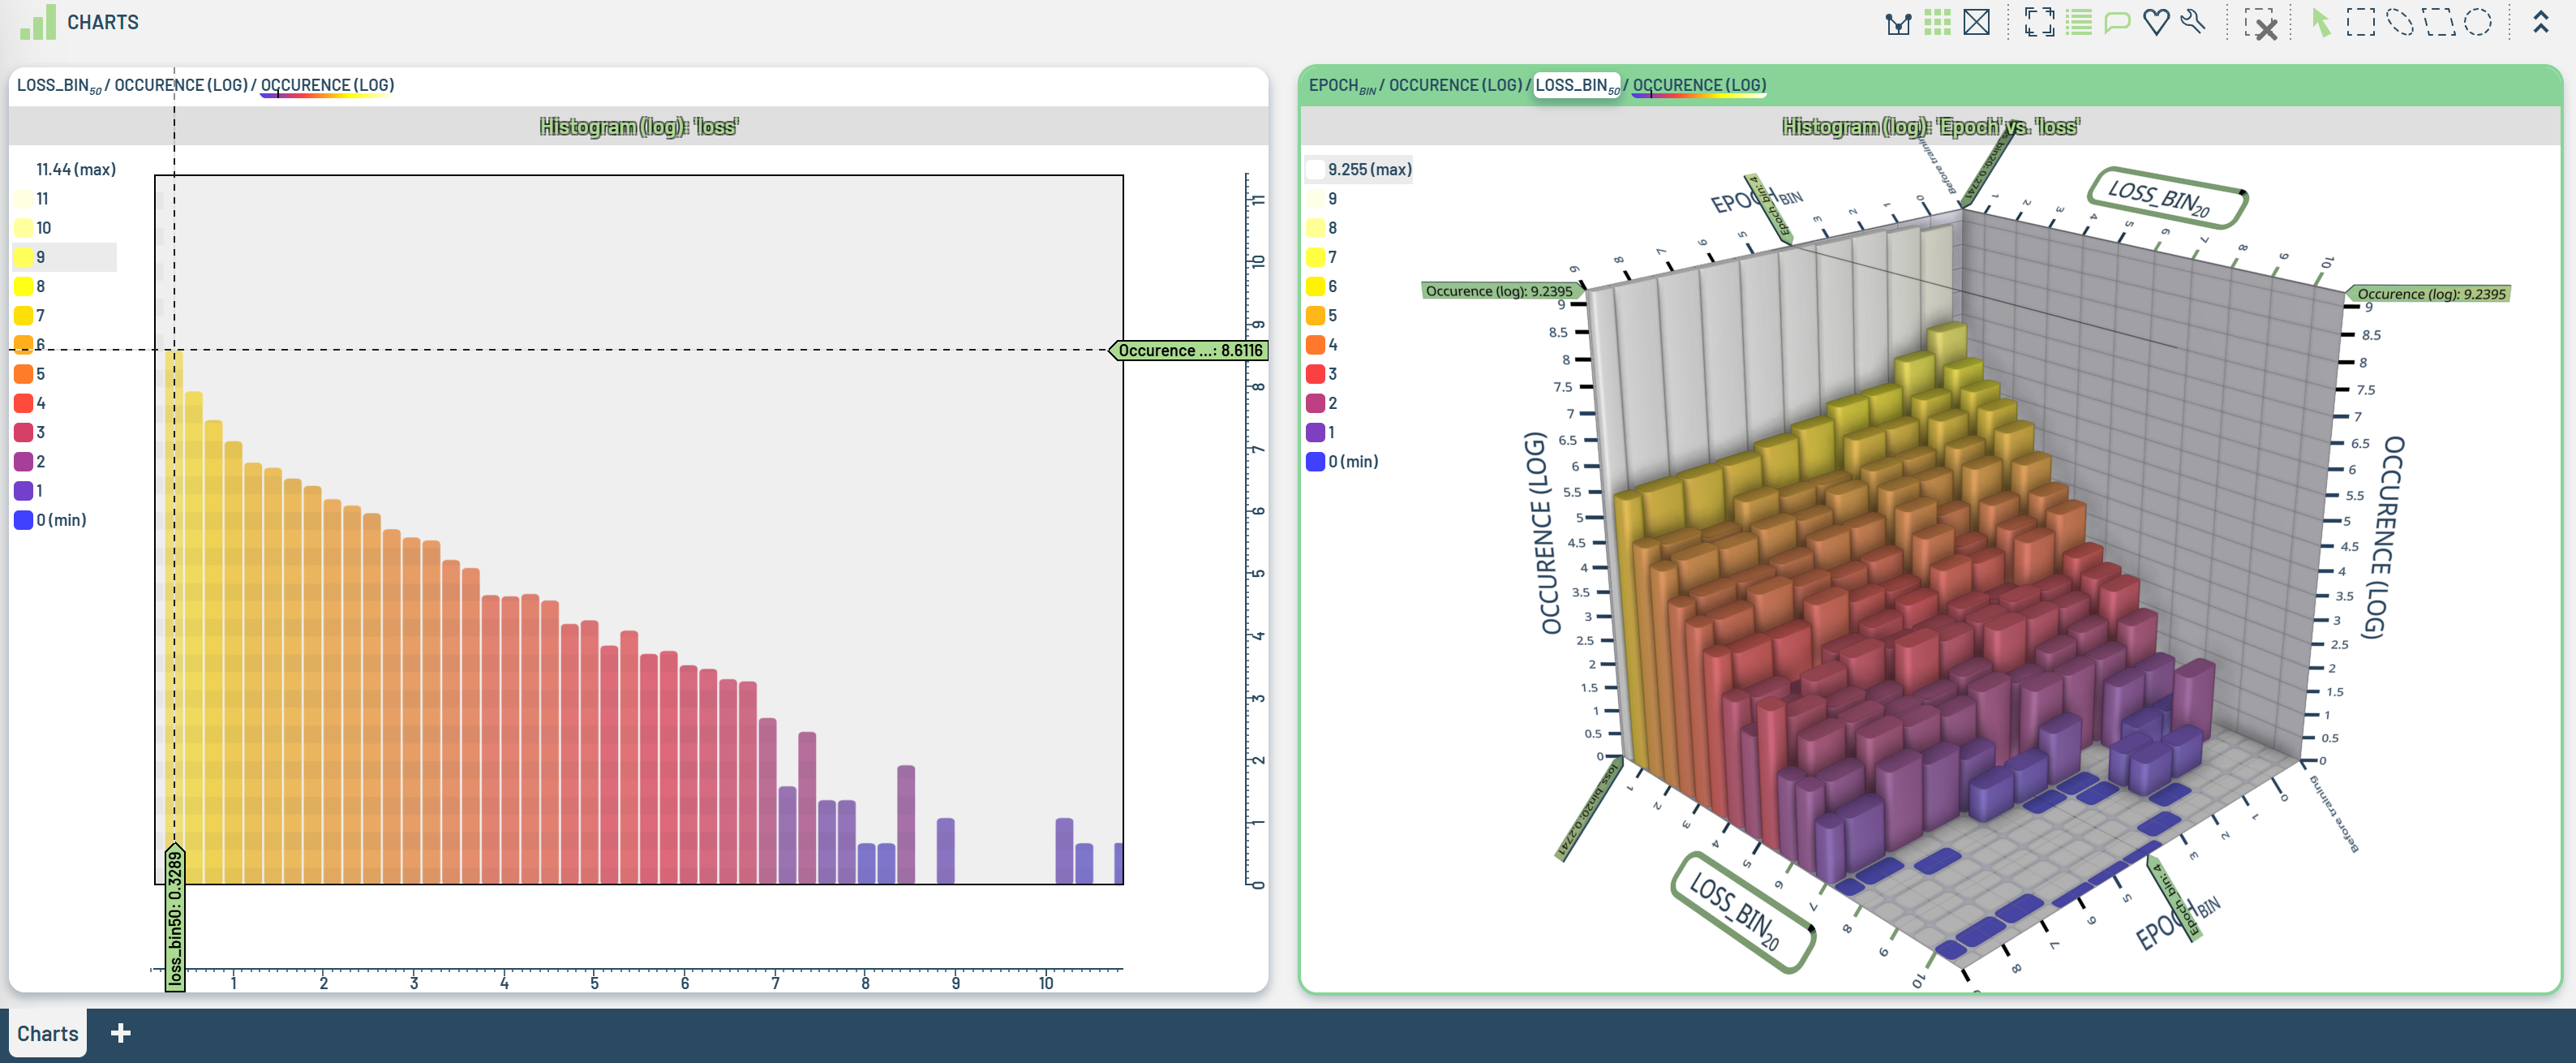
[14770] Added 1D/2D histogram workflows, which can be created by clicking on one/two columns and selecting from the Workflows sub-menu, or by using the following keyboard shortcuts:
Shift+1 - Show 1D histogram of selected column
Shift+2 - Show 2D histogram of two selected columns
Shift+3 - Show logarithmic 1D histogram of selected column
Shift+4 - Show logarithmic 2D histogram of two selected columns
[14896] Updated workflows that apply to BBs to also be applied to instance segmentation
[14122] Added new “Advanced label filtering” workflow to demonstrate tricks for performing advanced label filtering
[15000] Made it so that matched search phrases are highlighted
[14979] Added grid lines to 2D charts
[13579] Added OperationFilenameFromUrl
[14955] Added timestamp HMAC to Object Service requests when using
3lc-dashboardto serve the Dashboard in a 3LC Enterprise Customer Managed deployment. This adds an additional layer of security that ensures that the Object Service only handles requests from trusted Dashboard instances. Note that this requires the Object Service and Dashboard Service to be configured with a shared authentication secret. See the documentation on Secure Communication for details.
Enhancements and Fixes
[14980] Fixed a regression where tweaking “In set” virtual column could not do multi-class selection
Added OperationElementIndex
[14958] Fixed an issue where the “Accept predicted BB dialog” would disappear when clicking the label element
[14988] Fixed an issue where “Show filtered out elements greyed out in charts” from string filter properties was not working
[14999] Improved performance when hundreds of layers per segmentation image are present
[14929] Fixed metric element and BB selection mismatch after filters applied
[15001] Fixed assert when Inf in numeric array histogram collection
[15020] Copy prediction image size into ground truth image
Always allow navigating with Home and End key
Prevent incorrect autoscroll glitch
2.6.3
Enhancements and Fixes
[14844] Fixed URI encoding for URLs requested from object service, which allows for proper handling of all characters, particularly addressing a bug where 3LC data could not be loaded from a path using Chinese characters
[14936] Fixed a bug where pressing M would create an ineffective edit when no prediction was selected
[14927] Fixed large font size in some cases, such as when FN/FP/TP shown under BB/segmentation in chart
Fixed missing repaint when showing/hiding annotations
[14937] Made it so the travel distance workflow works with 1D column as embedding
[14941] Fixed an issue where making a commit would always log an error response from the object service even though it was successful
[14940] Handle case when segmentation layer has no pixels
[14947, 14926] Restored SSAO/edge shading to use previous library, which looks better and has better performance in general, and fixed bug that led to the recent change to a different SSAO library
[14945] Fixed recently introduced bug where closing an unselected chart would close all selected charts as well
[14954] Restored caching rules accidentally deleted in earlier 2.6 versions
[14943] When running
3lc-dashboardto serve the dashboard from an enterprise install, disable caching for the root like we do in the hosted version. In particular, this fixes an issue where the user could get a cached version of ‘/’ without the “object_service” cookie because it has expired, which means the dashboard cannot connect to the configured object service.
2.6.2
Enhancements and Fixes
[13465] Colorized the scrollbar in the Table panel based on row colors
[14751] Tweaked paint and erase cursors to clarify their purpose
[14877] Made it so the ForgettingEvents and AggregateCharts workflows place charts in separate tabs
[14872] Fixed a bug causing the application to sometimes switch away from the current screen to the Projects panel
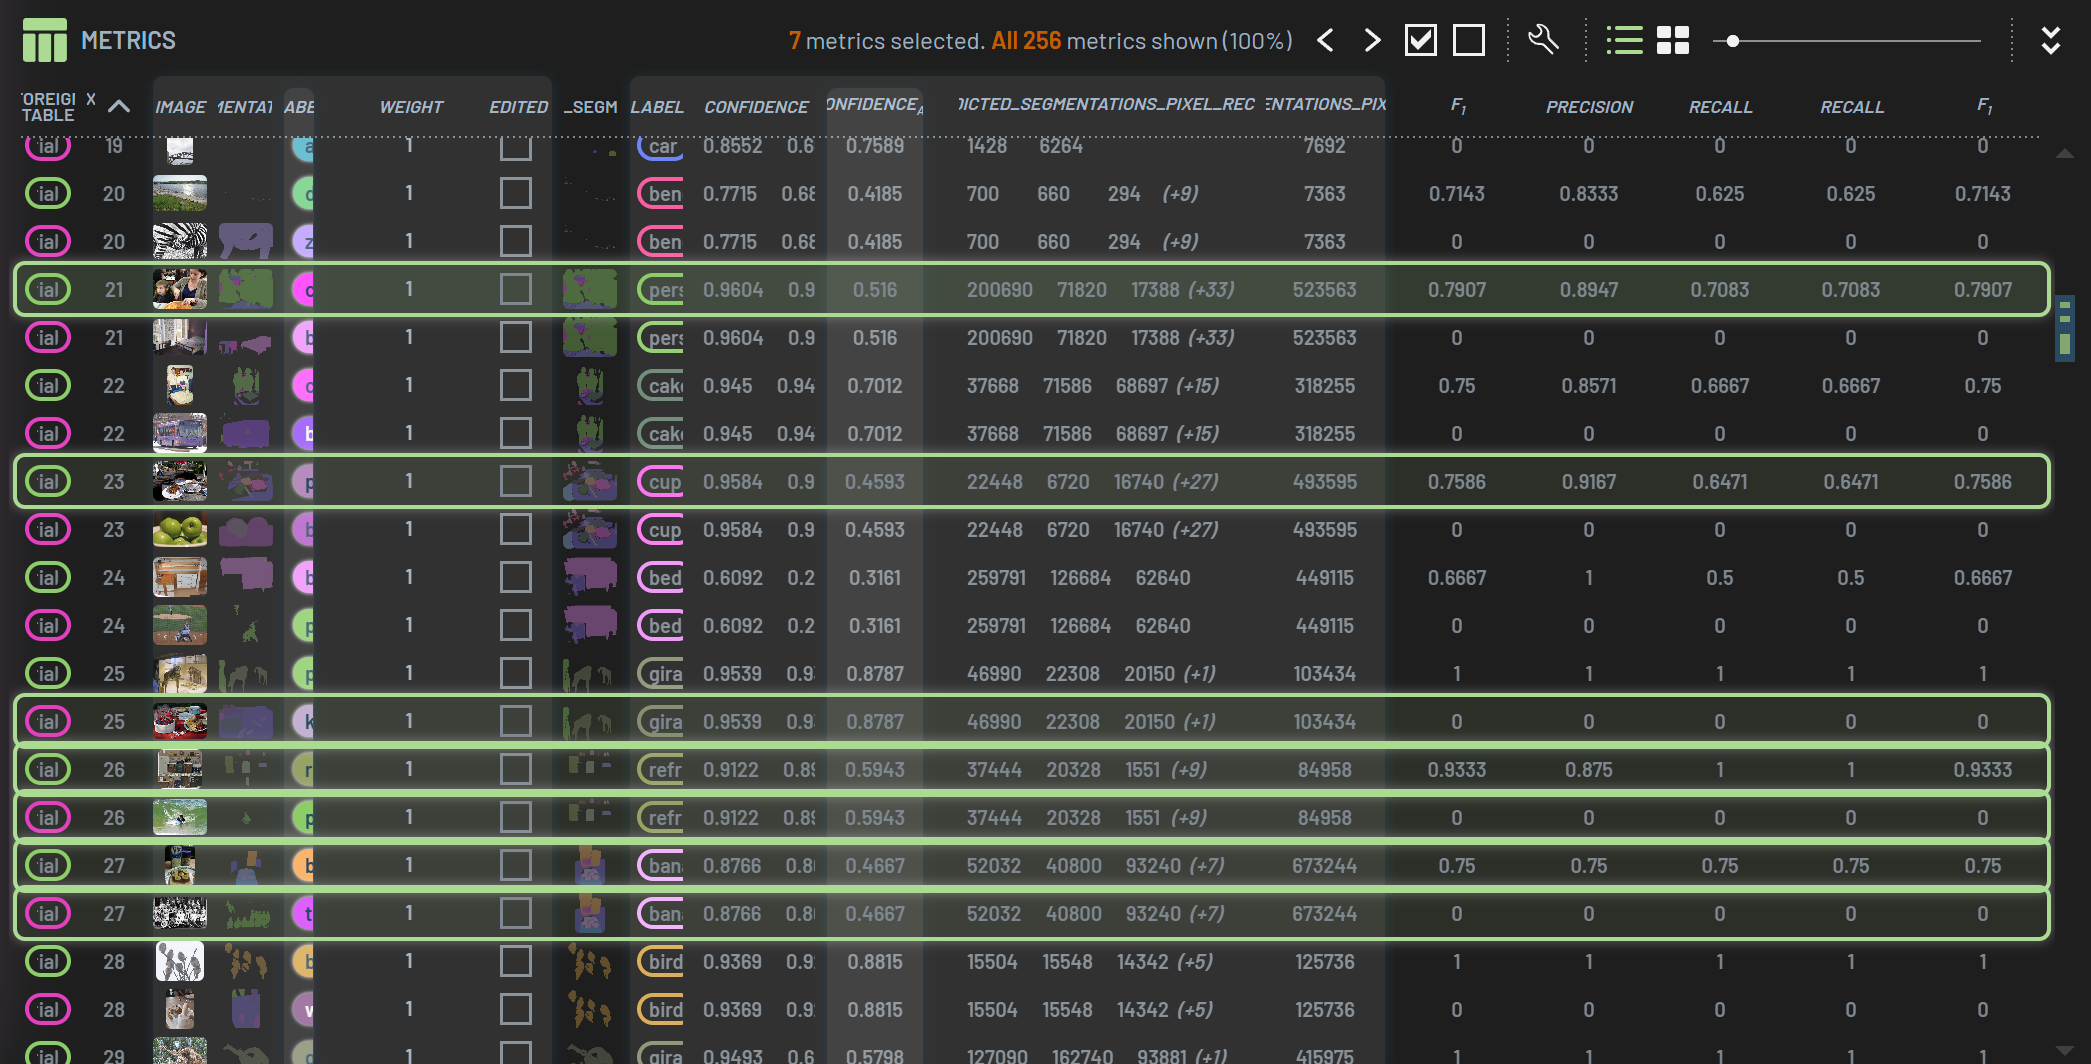
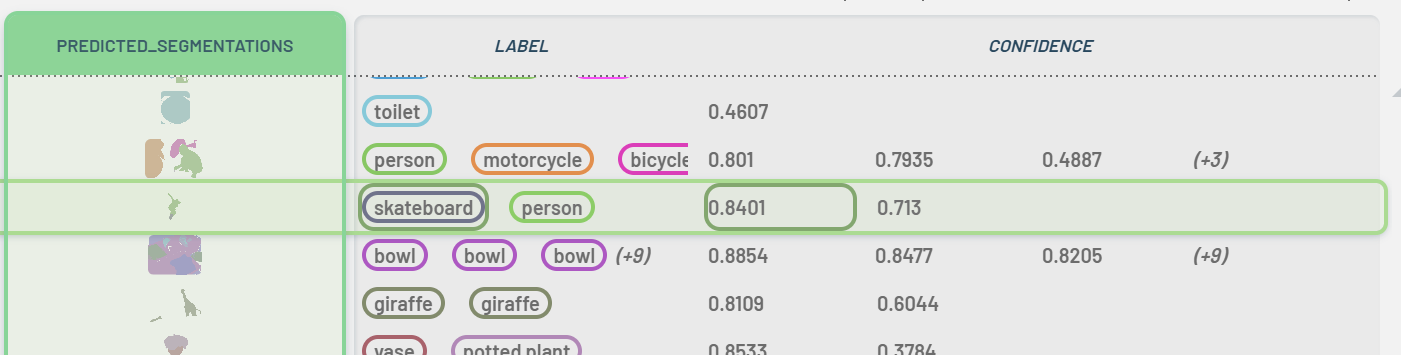
[14870] Added some color tables for F1/Recall/Precision
[5531] Made it so the animated hover line within charts is now also populated from aggregated or reduced data
[14887] Made it so closing a chart closes all selected charts, not only the one being clicked
[14917] Fixed a bug where deleting the last layer in a multi-layer image would cause the the metadata to be deleted but not the actual geometry, unless the image had been unselected scrolled away from it before committing
2.6.1
Features
[13679] Added support for user-configurable line stitching. The default behavior is unchanged, but the new “Connect by” setting can be used to stitch together a connected polyline using the selected property.
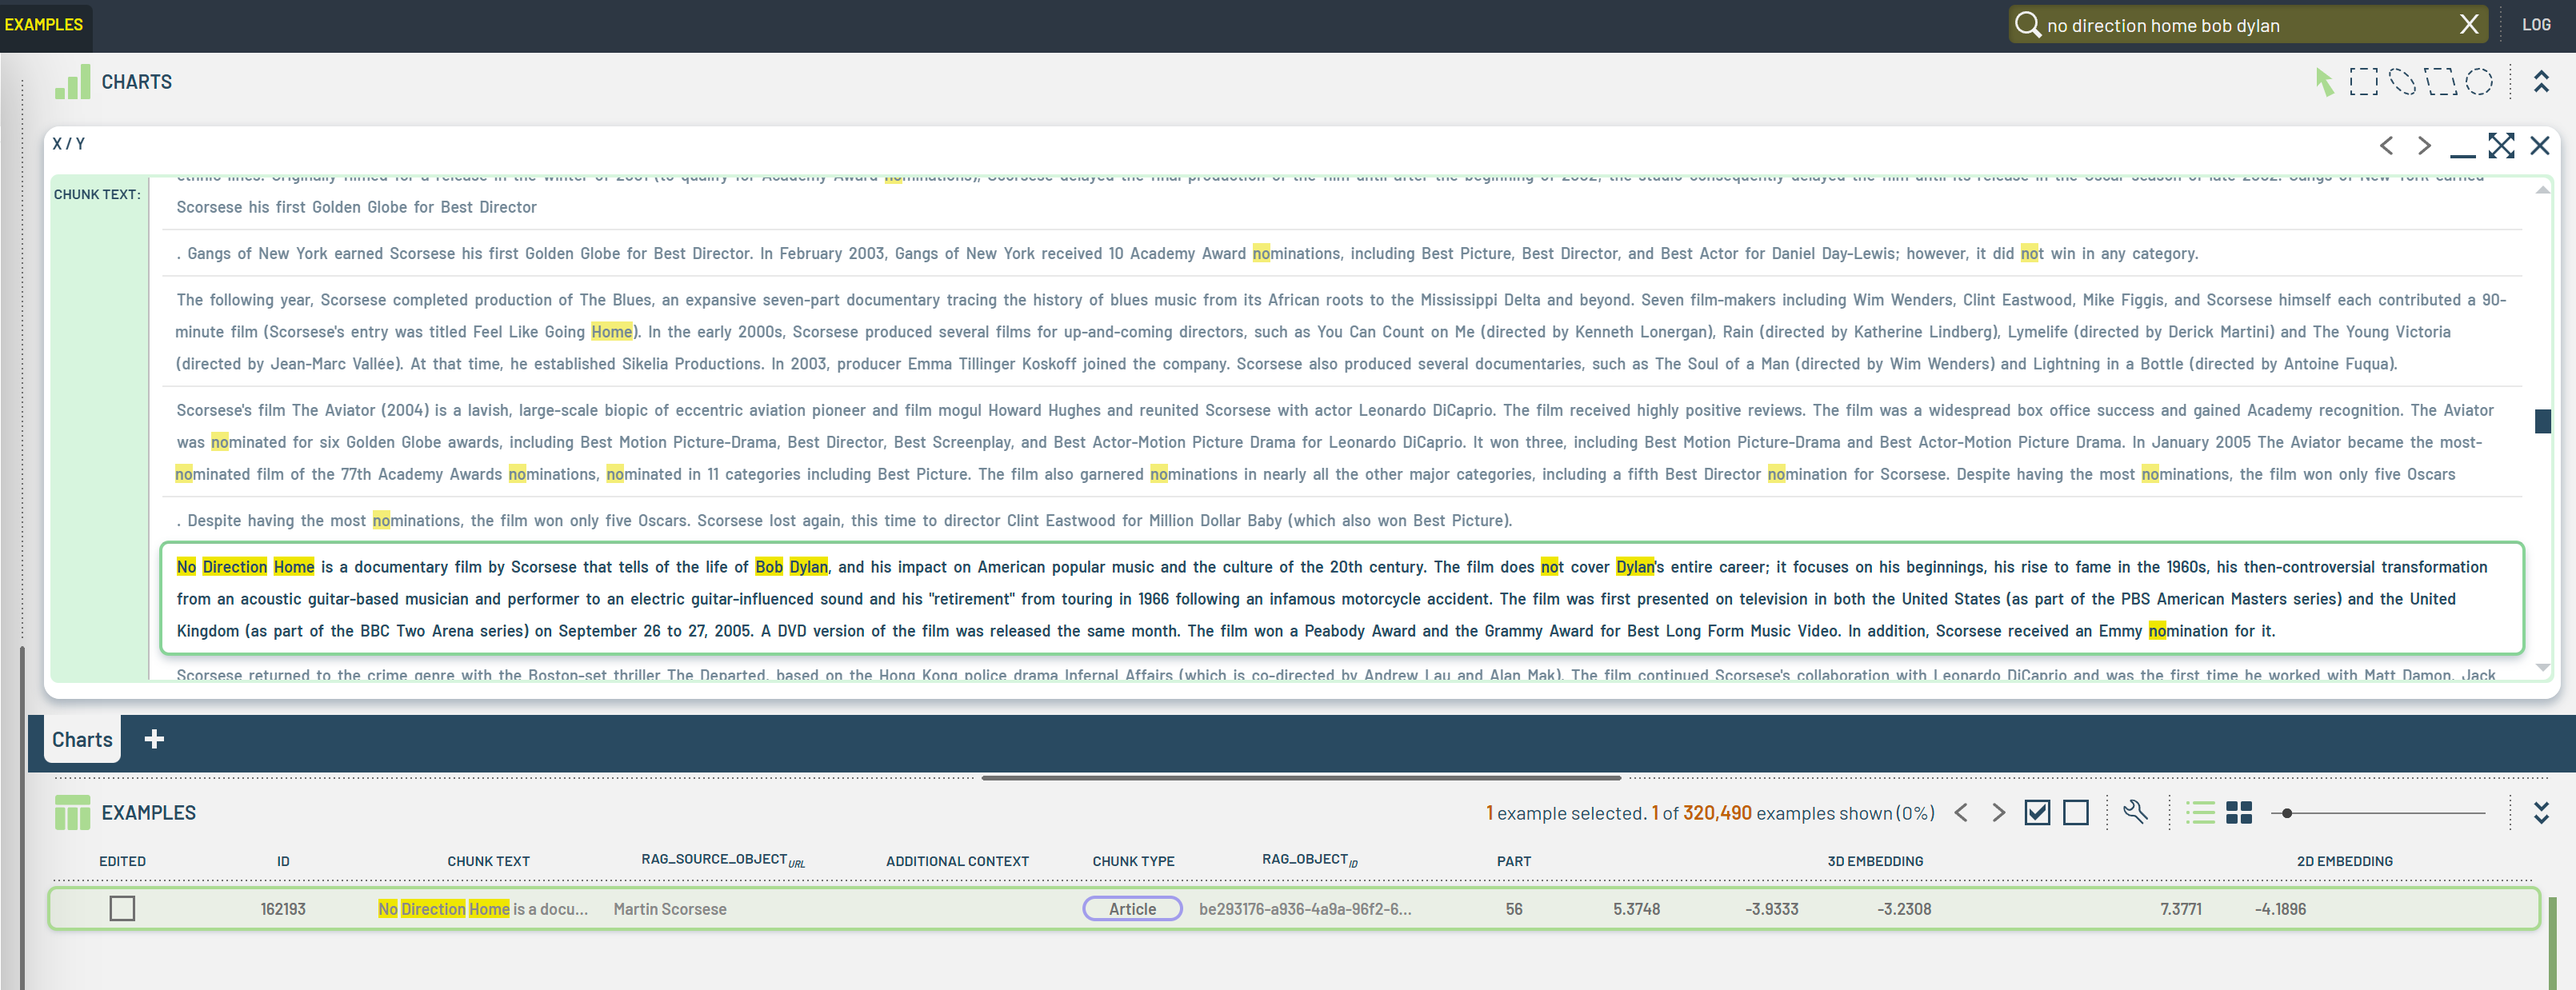
[14814] Implemented workflows for viewing Precision/Recall/F1 values in Table panel and 2D/3D charts.
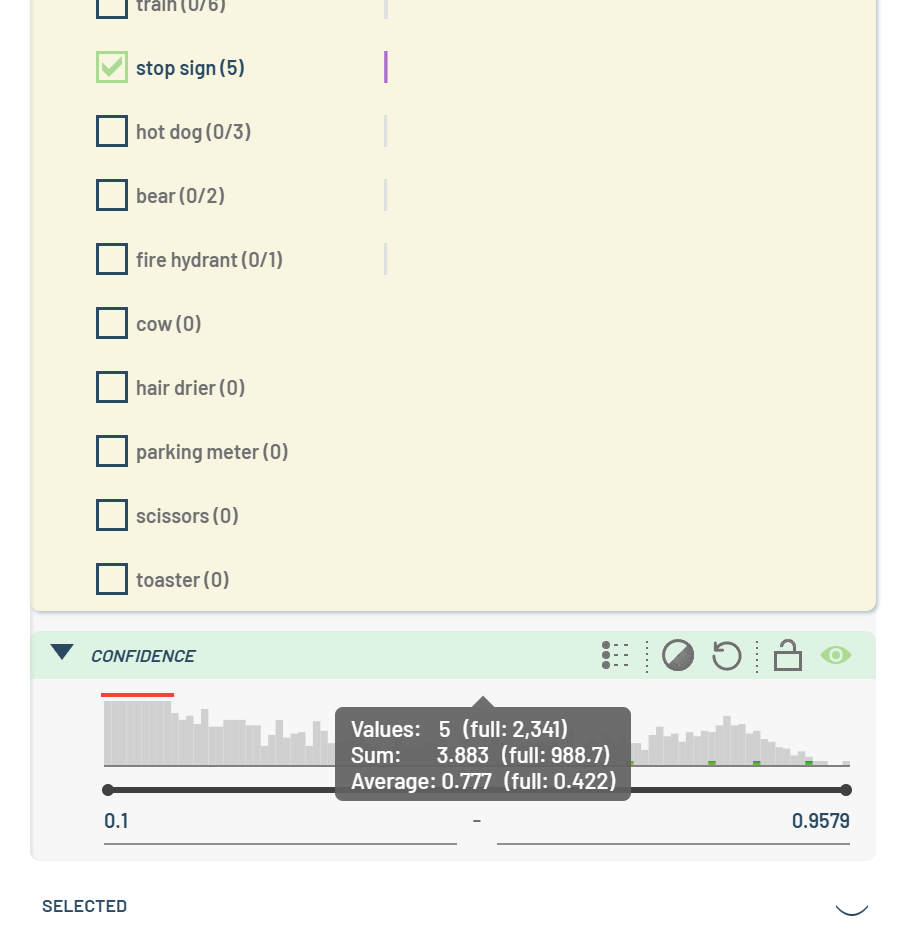
[14851] Show property count/sum/average in filter panels
Enhancements and Fixes
[14831] Made it possible to view/select array elements in the Table panel
[14794] Replaced old SSAO and edge-shading code with new library that fixes long-standing glitch where the SSAO exhibits defects
[14830] Made the colorize-by setting part of the favorite configuration so that when colorizing table rows and/or cell values, the same setup is applied when opening a new Run/Table
[14850] Made it so workflows can optionally add new Charts to named ChartsPanel
[14813] Virtual columns operating on a pair of (ground truth, prediction) columns (e.g. bounding boxes) now have an optional parameter ‘Label policy’ that allows for one of the following:
Requiring Labels to match (the default behavior)
Ignoring Labels altogether
Limiting the operation to one particular label (e.g. cats or dogs).
Fixed performance degradation when updating the shared cursor in 3D
2.6.0
Features
[13950] Require login to 3LC account now that the 3LC Beta is over
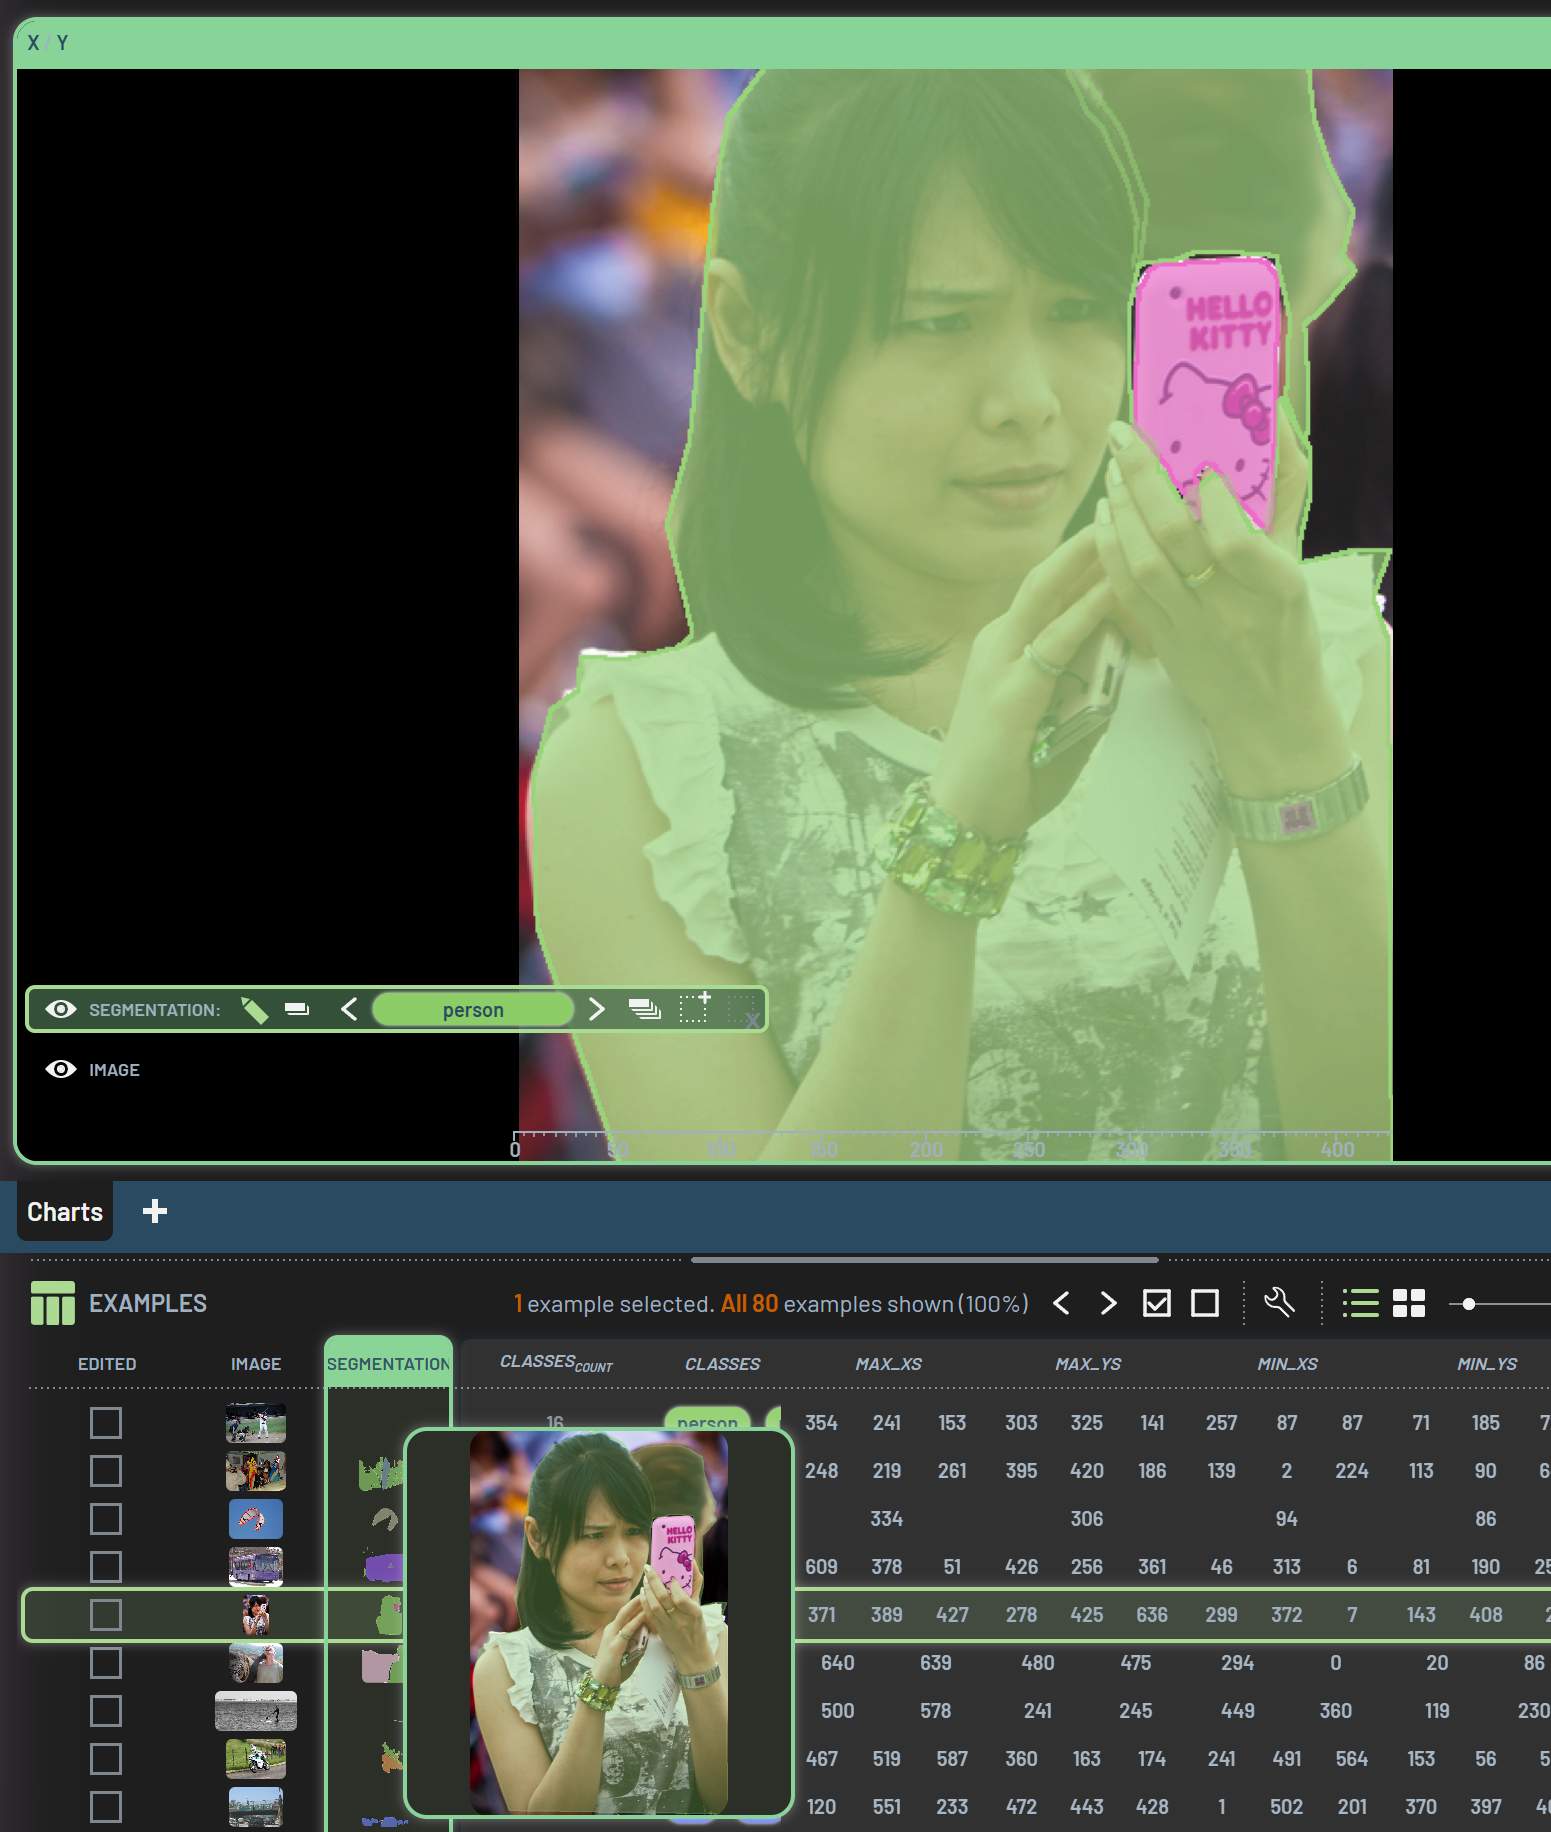
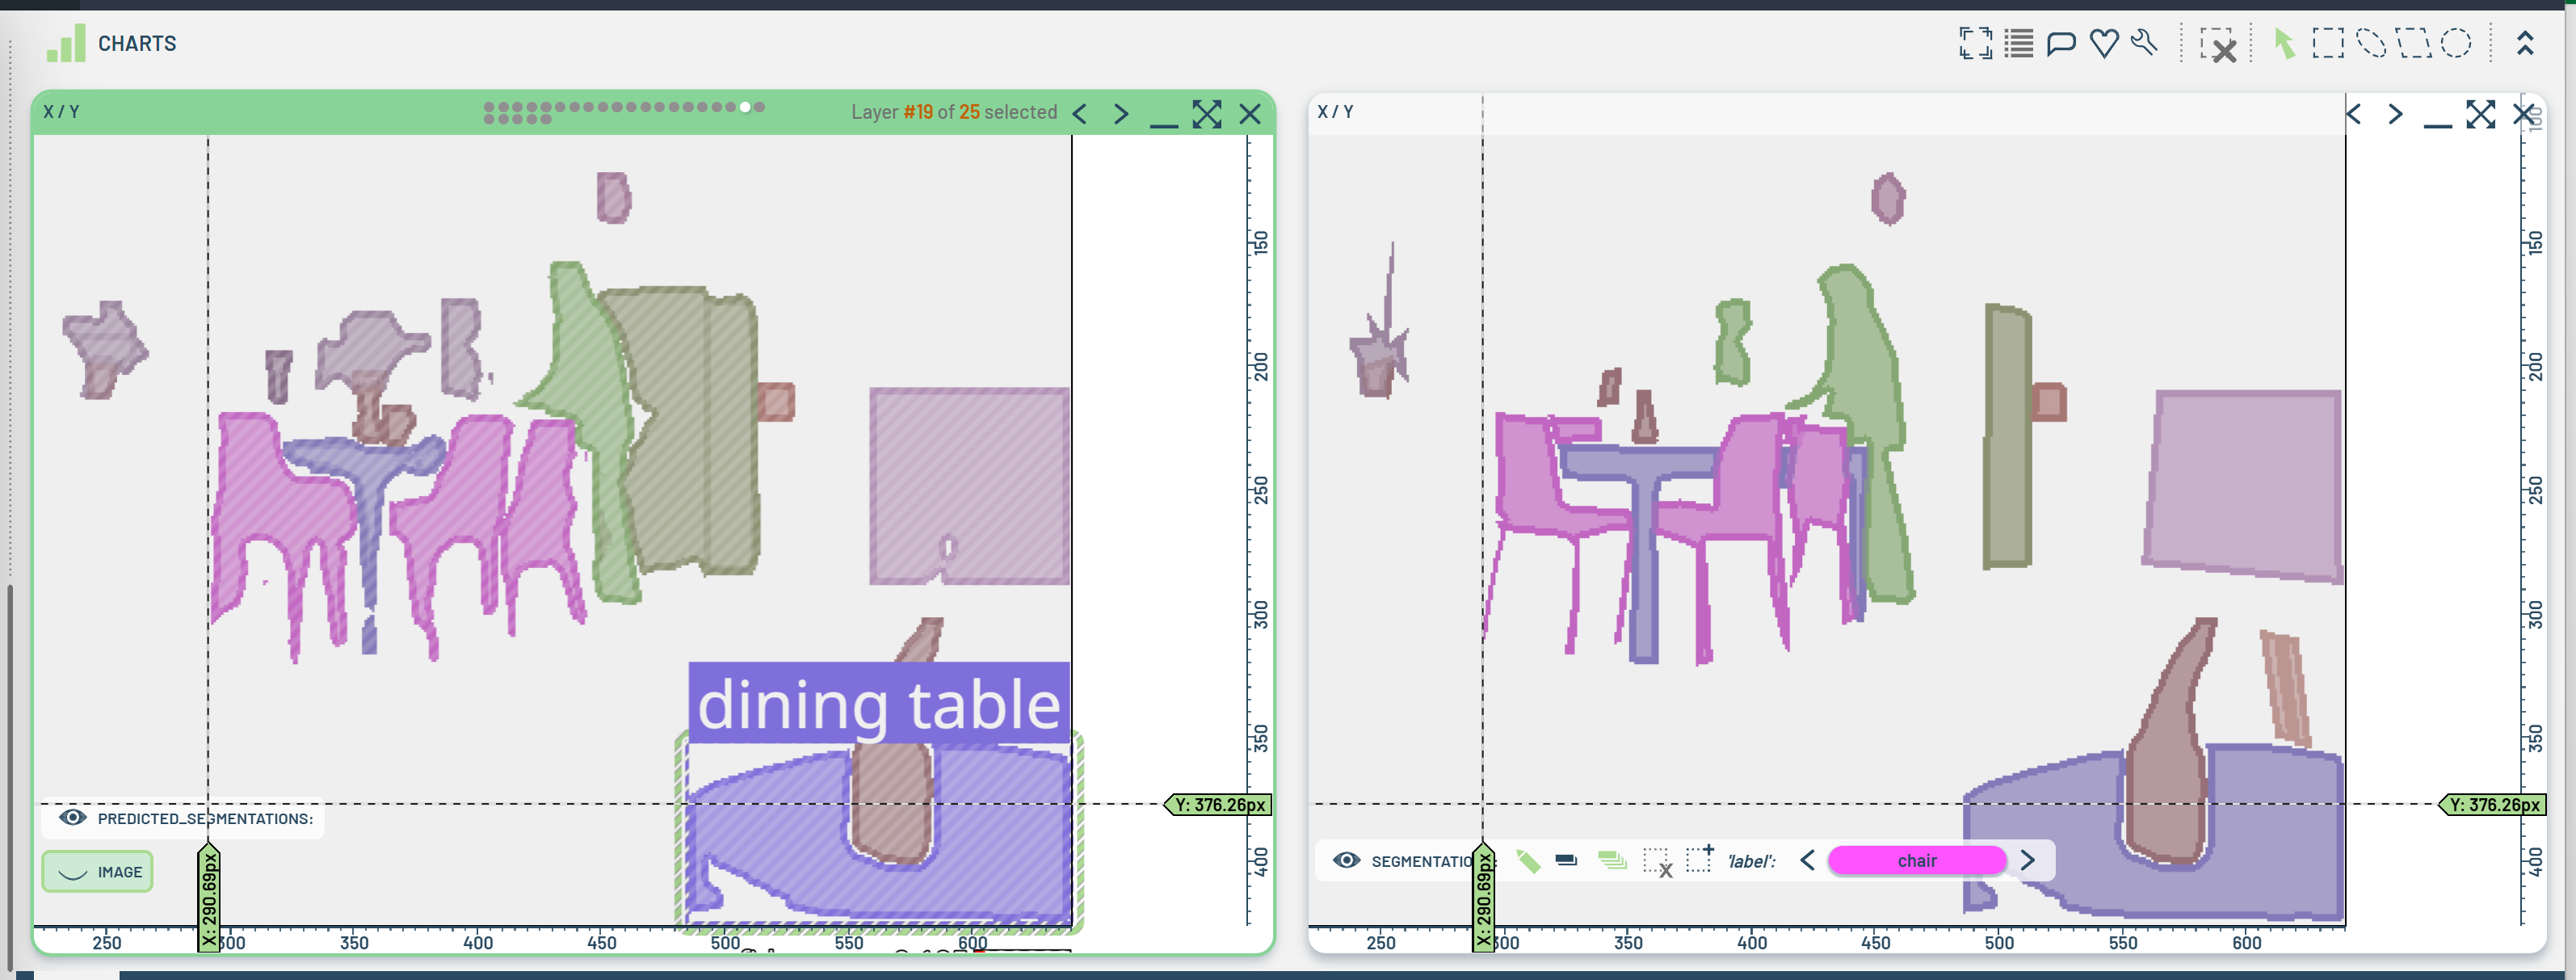
[14254] Added support for instance segmentation
Support rendering from multi-layer images, both in tables and in charts:
Dashed lines are used to render predicted masks (just like for bounding box outlines):
Filtered-out layers are by default hidden (but can optionally be shown by toggling 1, just like for bounding boxes)
Editing of multi-layer images is basically a superset of single-layer editing (including undo/redo/commit)
Removed keyboard shortcut J to pick active paint value
Instead, implemented the following modifiers to left-mouse-button down operations:
LeftButton “PAINT”
Single-layer: Paint with current Label
Multi-layer: Paint into selected layer
Shift+LeftButton “ERASE”
Single-layer: -
Multi-layer: Erase from all selected layers
Ctrl+LeftButton “PICK”
Single-layer: Pick active paint value from texel under mouse pointer
Multi-layer: Select layer from texel under mouse pointer
Shift+Ctrl+LeftButton “PICK MORE”
Single-layer: -
Multi-layer: Add layer to selection (from texel under mouse pointer)
Ctrl+DoubleLeftClick
Single layer: Zoom to contents of connected area (effectively doing a flood fill)
Multi-layer: Select layer and zoom to contents
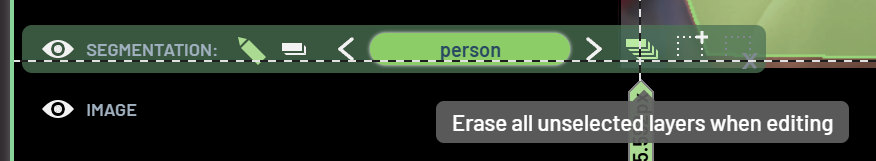
In multi-layer mode, there’s a flag which indicates whether to erase from all non-selected layers when painting (but not when erasing). Default is ON:
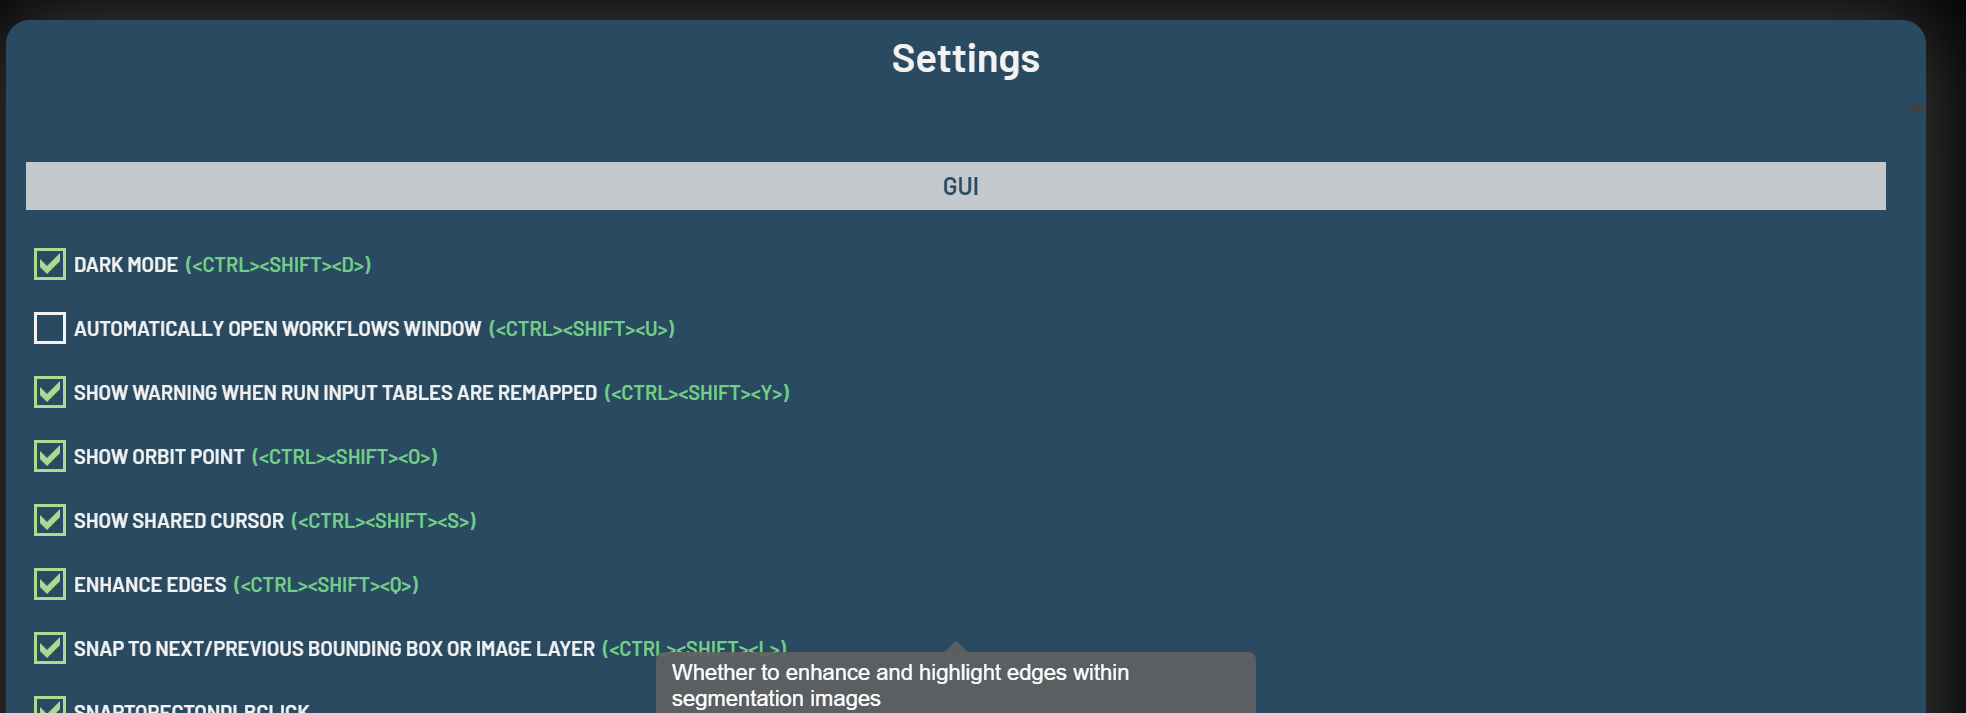
There’s a global Settings flag Enhance edges which is used when rendering multi-level images:
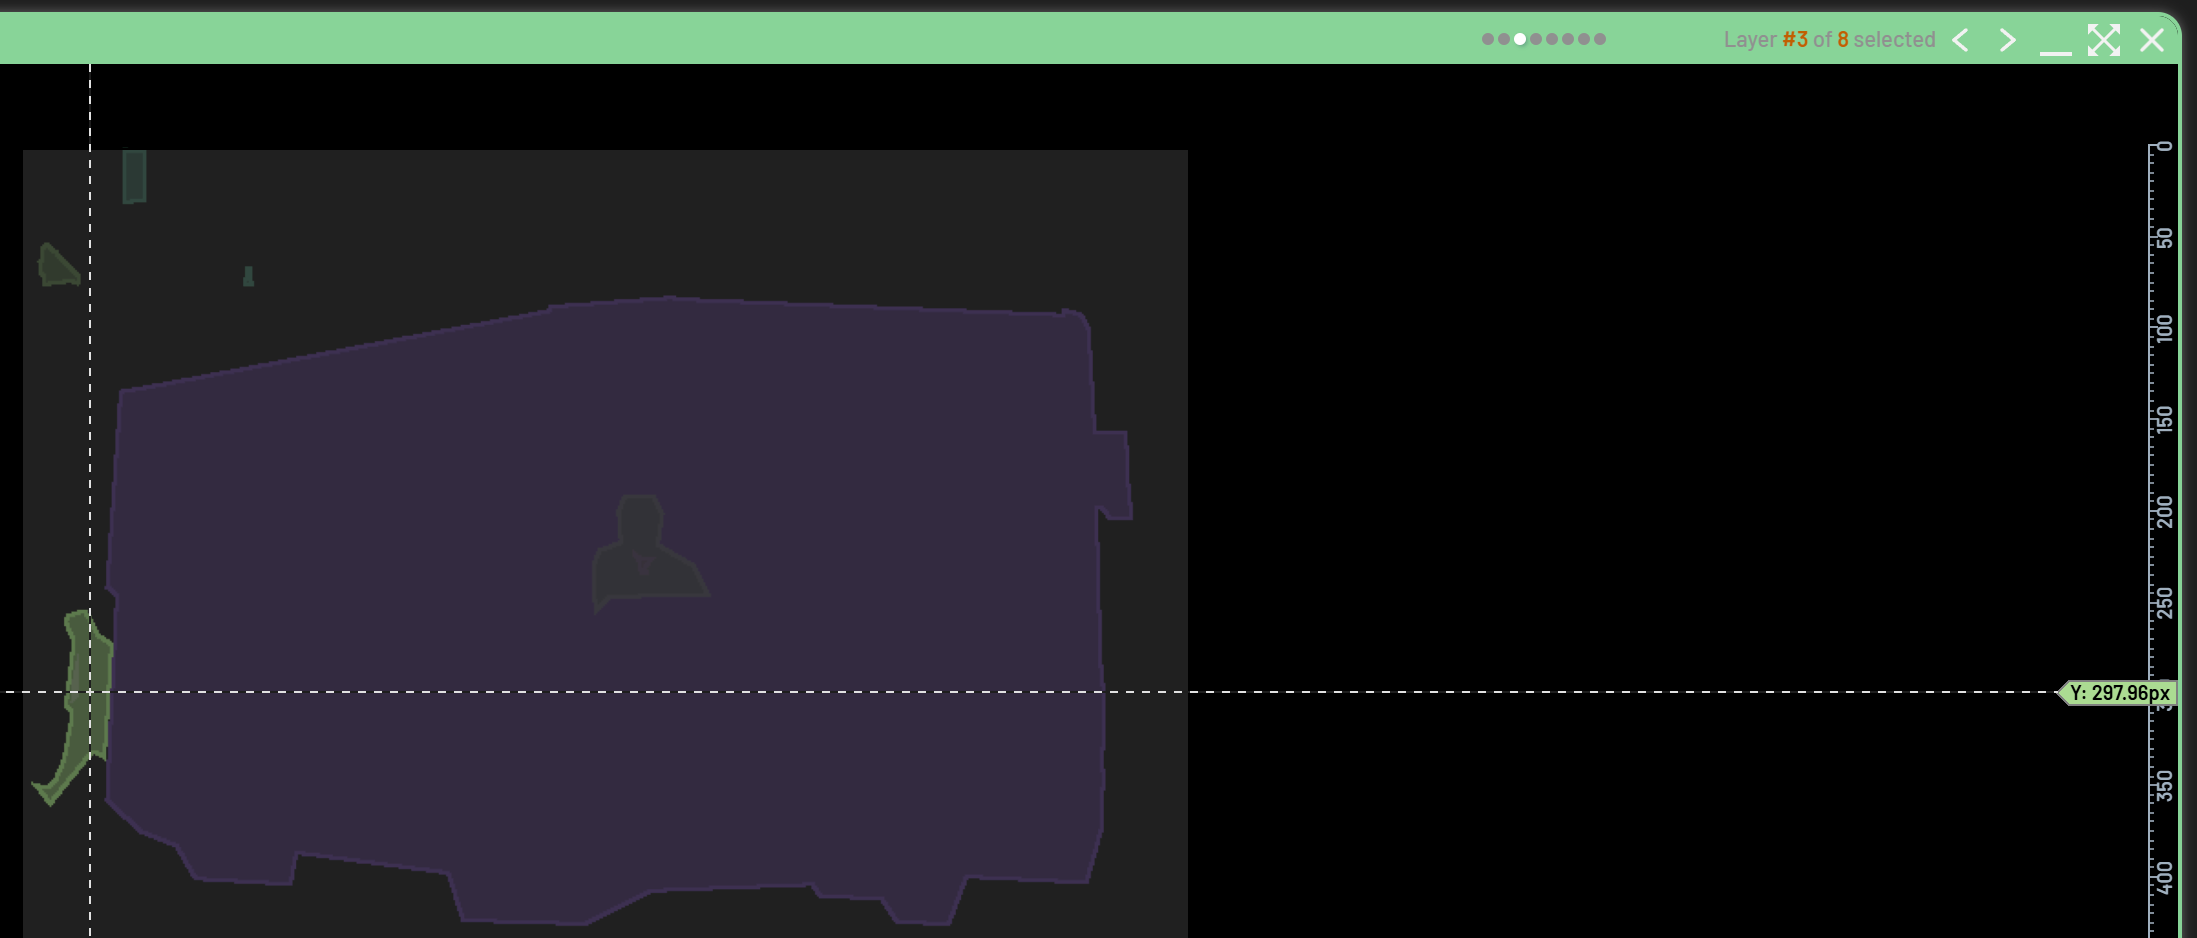
Selection of layers is represented like other array elements (e.g. bounding boxes) and shown on the window title:
Next/prev works just like for bounding boxes, and the same goes for auto-zoom-to-selected
Min/max X/Y, pixel-count, circumference and island-count of each layer is updated when editing and can be filtered on, visualized, etc.
Added buttons “Add layer” and “Delete selected layer(s)”, with shortcut for the latter being the ordinary Del key
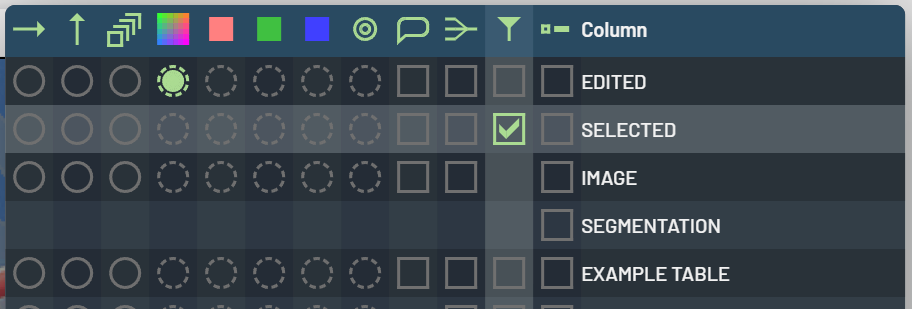
Allow usage of Selected and Edited column in charts, just like any other columns:
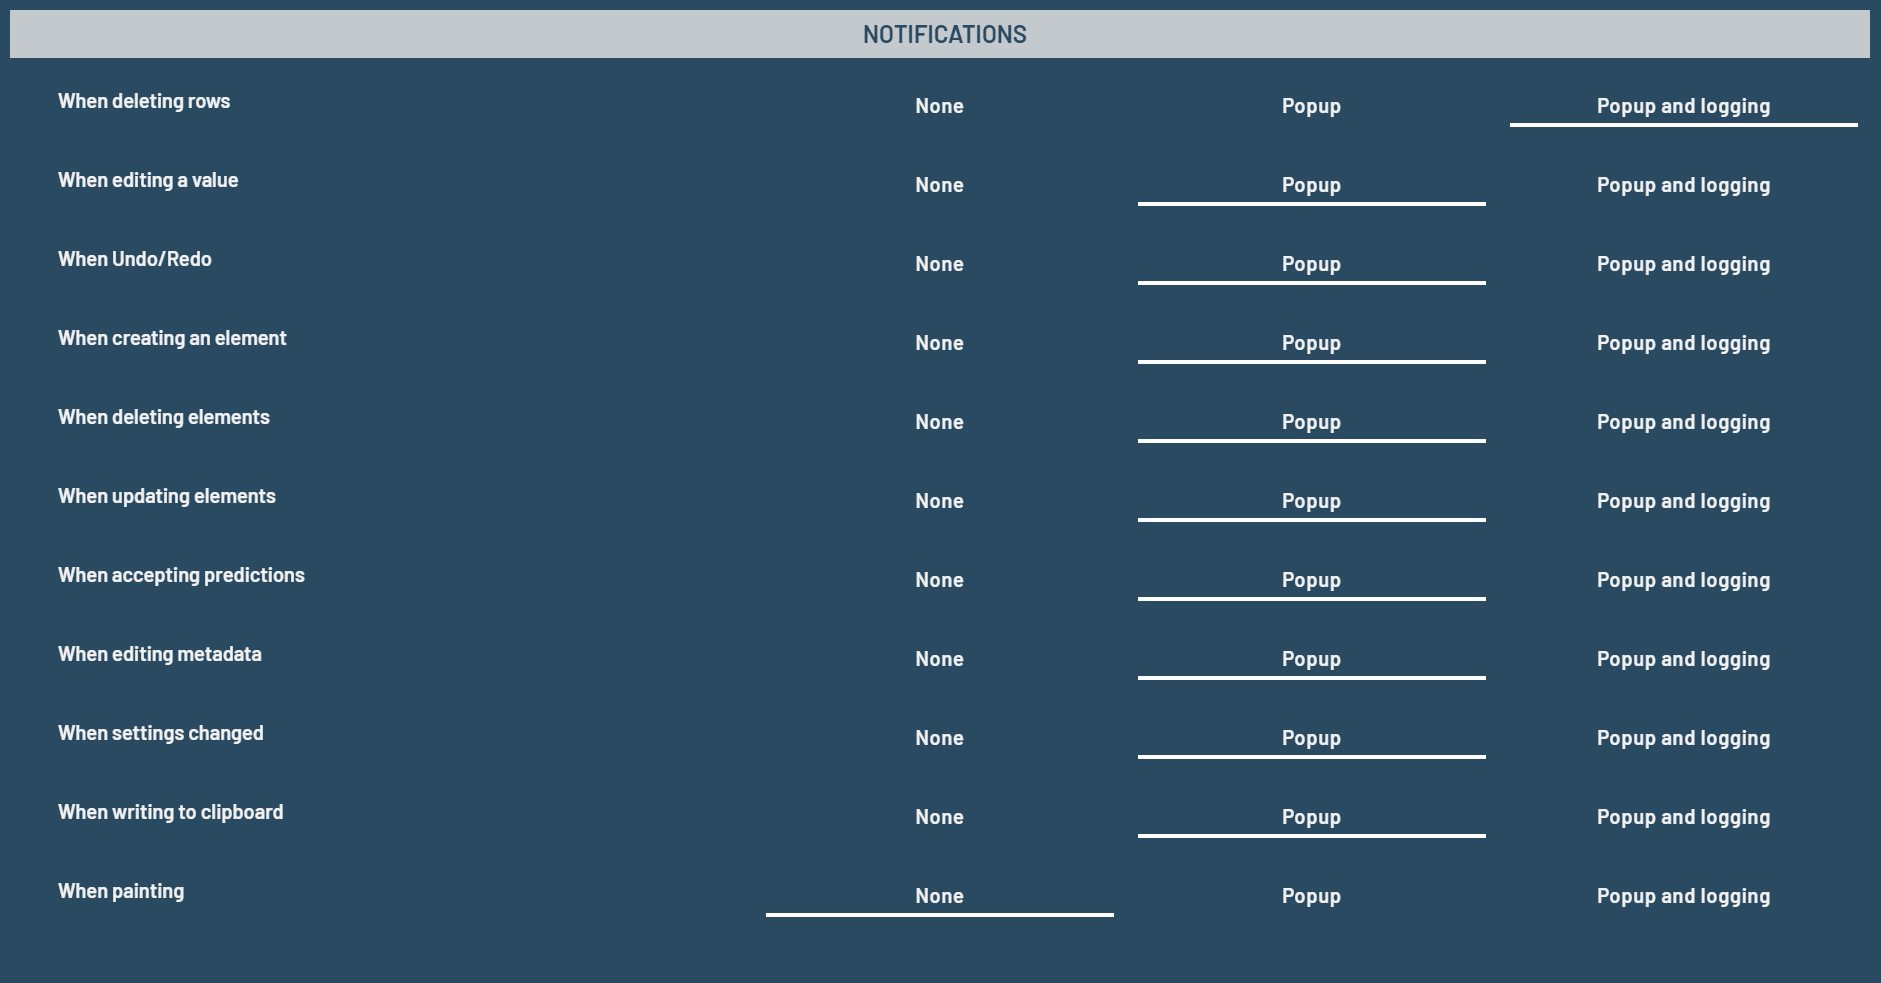
Standardized display of popup-messages and logging behavior by adding Settings attributes that determine what happens when specific actions are performed:
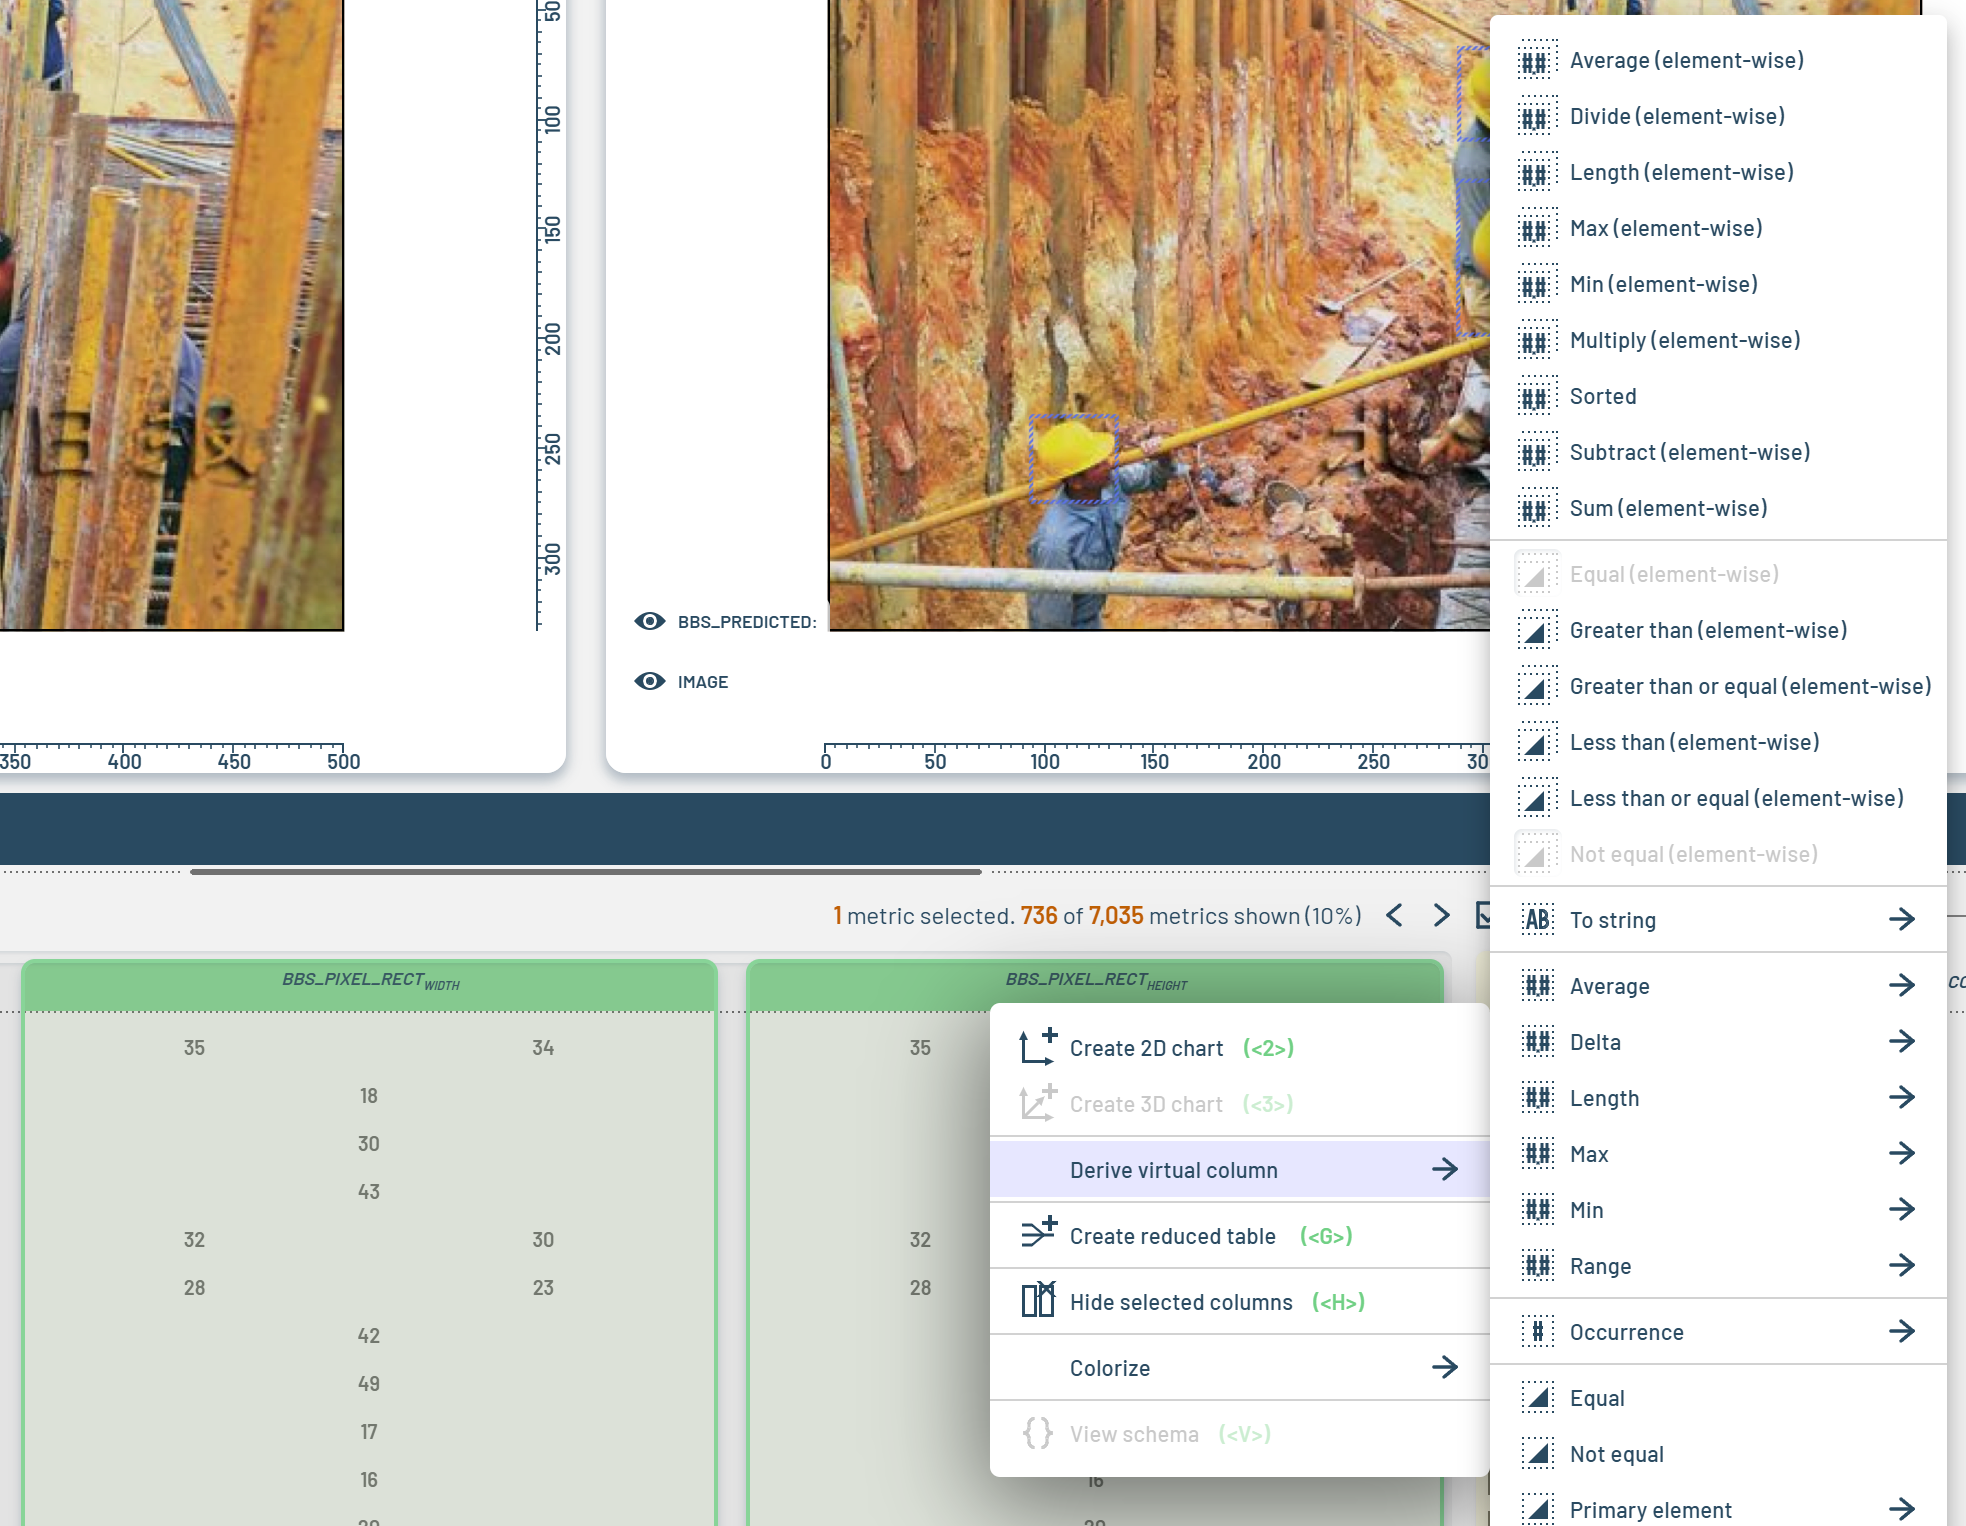
Enabled operations between multi-entry columns and single-entry columns, and per-element operations on arrays when ArraySignatures match:
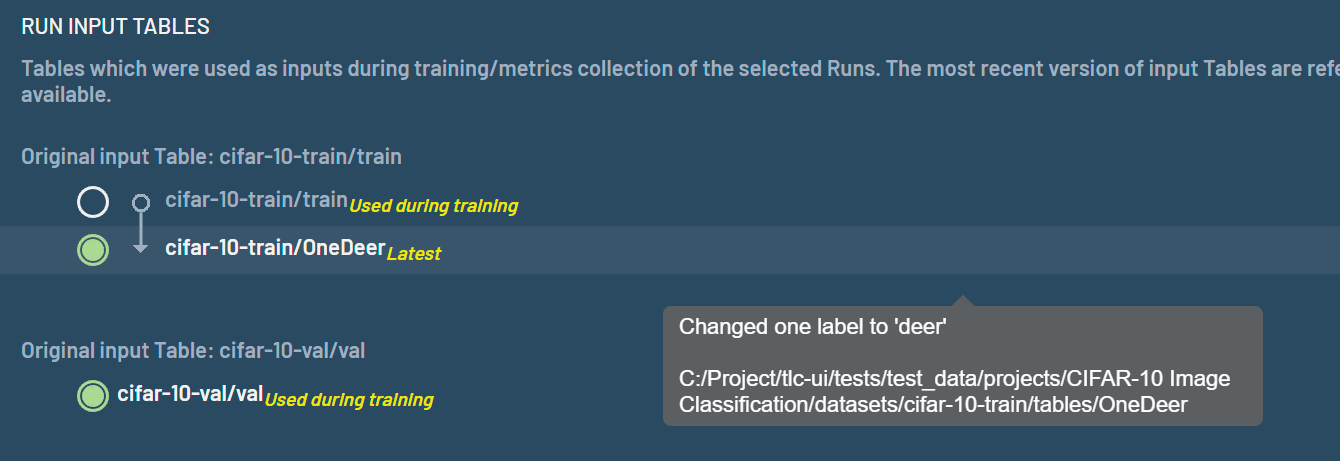
Made it so that hovering over a Table in the Run Details dialog shows the Table’s description:
Added ‘sum’ column to ReducedTable (for relevant columns)
Added OperationParseString virtual column where the input string is parsed as a number
[14684] Allowed for reducing on array columns (e.g. BbList Label), and include “Count” per reduce group
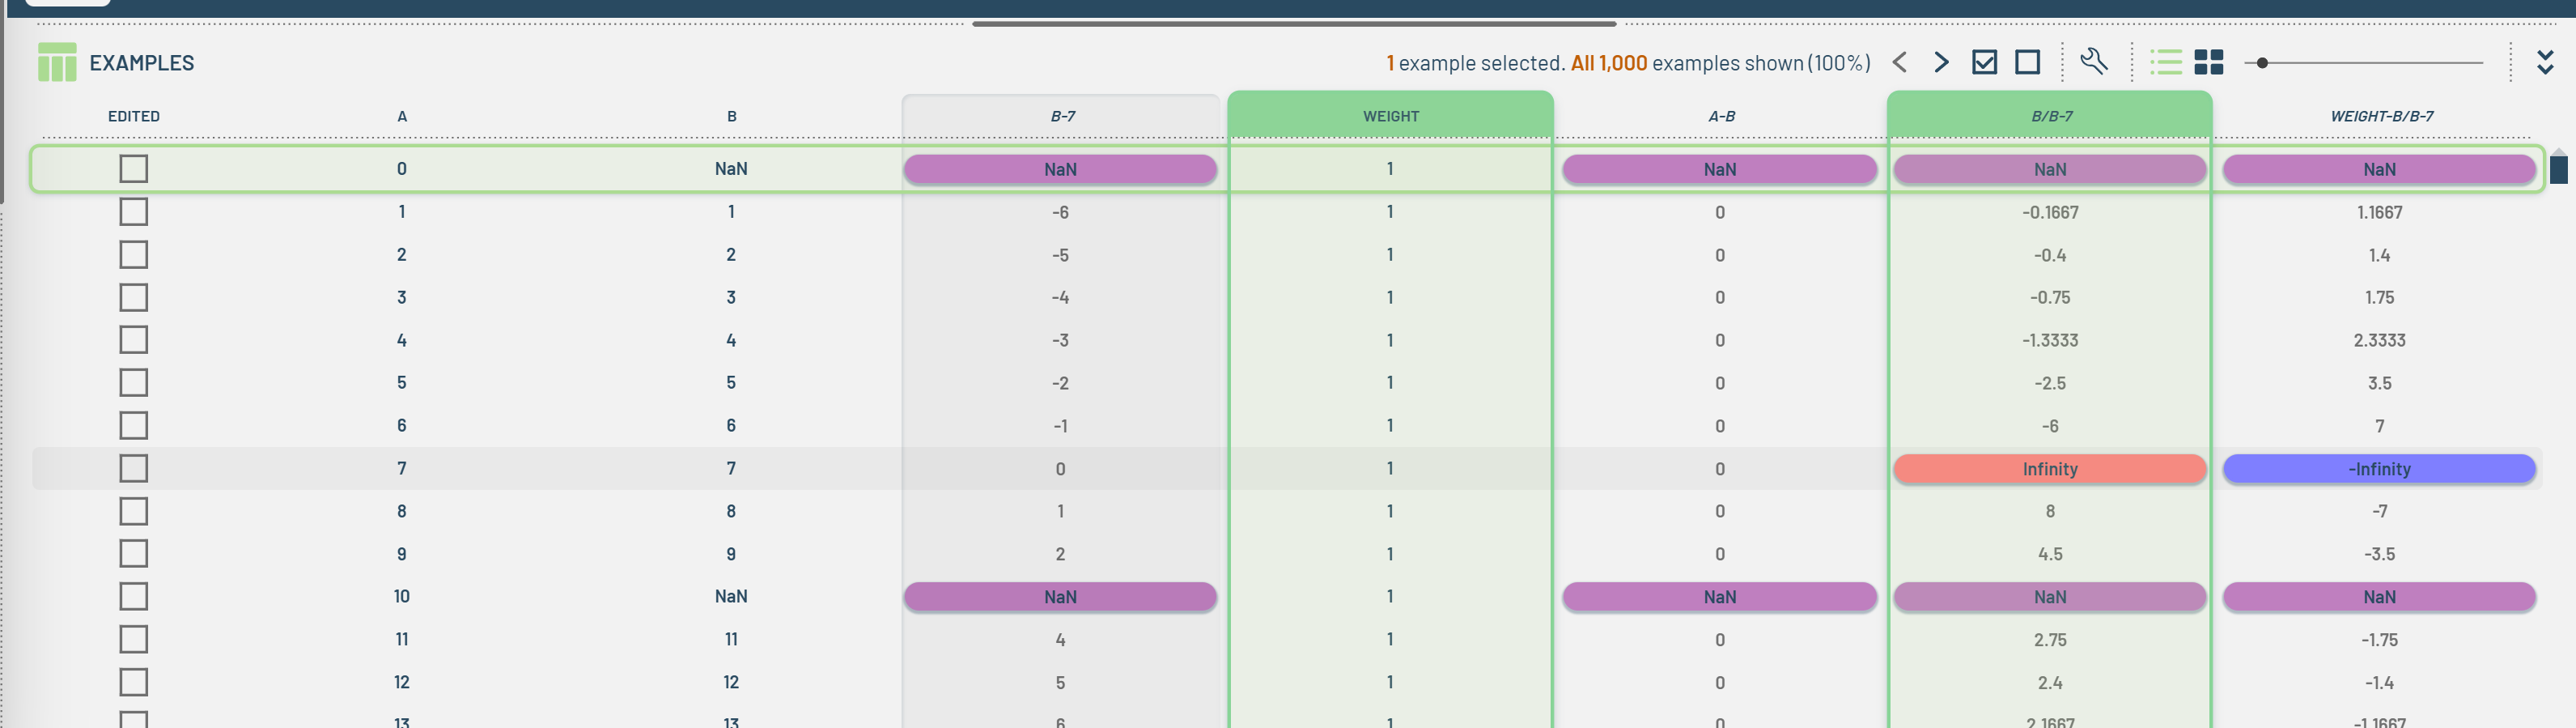
[14253] Added handling for non-finite values (NaN, negative infinity, positive infinity)
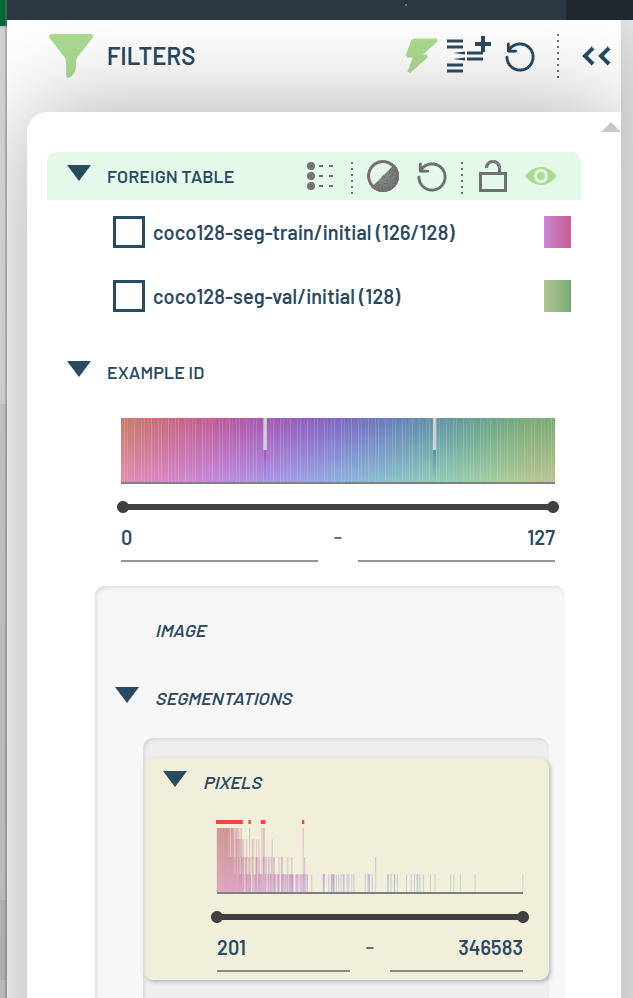
Added global flag “Live filters”, available in the Settings dialog or with the keyboard shortcuts S or Shift+Ctrl+S and also exposed in the Filters panel as the lightning icon on the toolbar:
The flag is automatically set to True at application startup or whenever any change is made to the filter values
When setting the flag to False, edits of e.g. bounding boxes or segmentation layers will NOT cause the FilteredTable to be recomputed automatically. This means that those elements (or entire table rows) will still be visible even though they would otherwise have been filtered out.
Enabling the flag will cause the FilteredTable to be recomputed immediately
[14672] Optionally link virtual column parameters via global variables
As an example, TP calculations have an IoU threshold, and one would typically want to use the same value in a different FP calculation
Currently only available for operations on two BB or segmentation columns, e.g. “Matched predictions”
By default, all operations with an IoU threshold will now share the same global value, meaning a change to one will change them all:
If one sets “Linked value” to “(None)” then the slider will again control only that particular column value.
Made it so legends can be colored from continuous ranges (similar to from value maps)
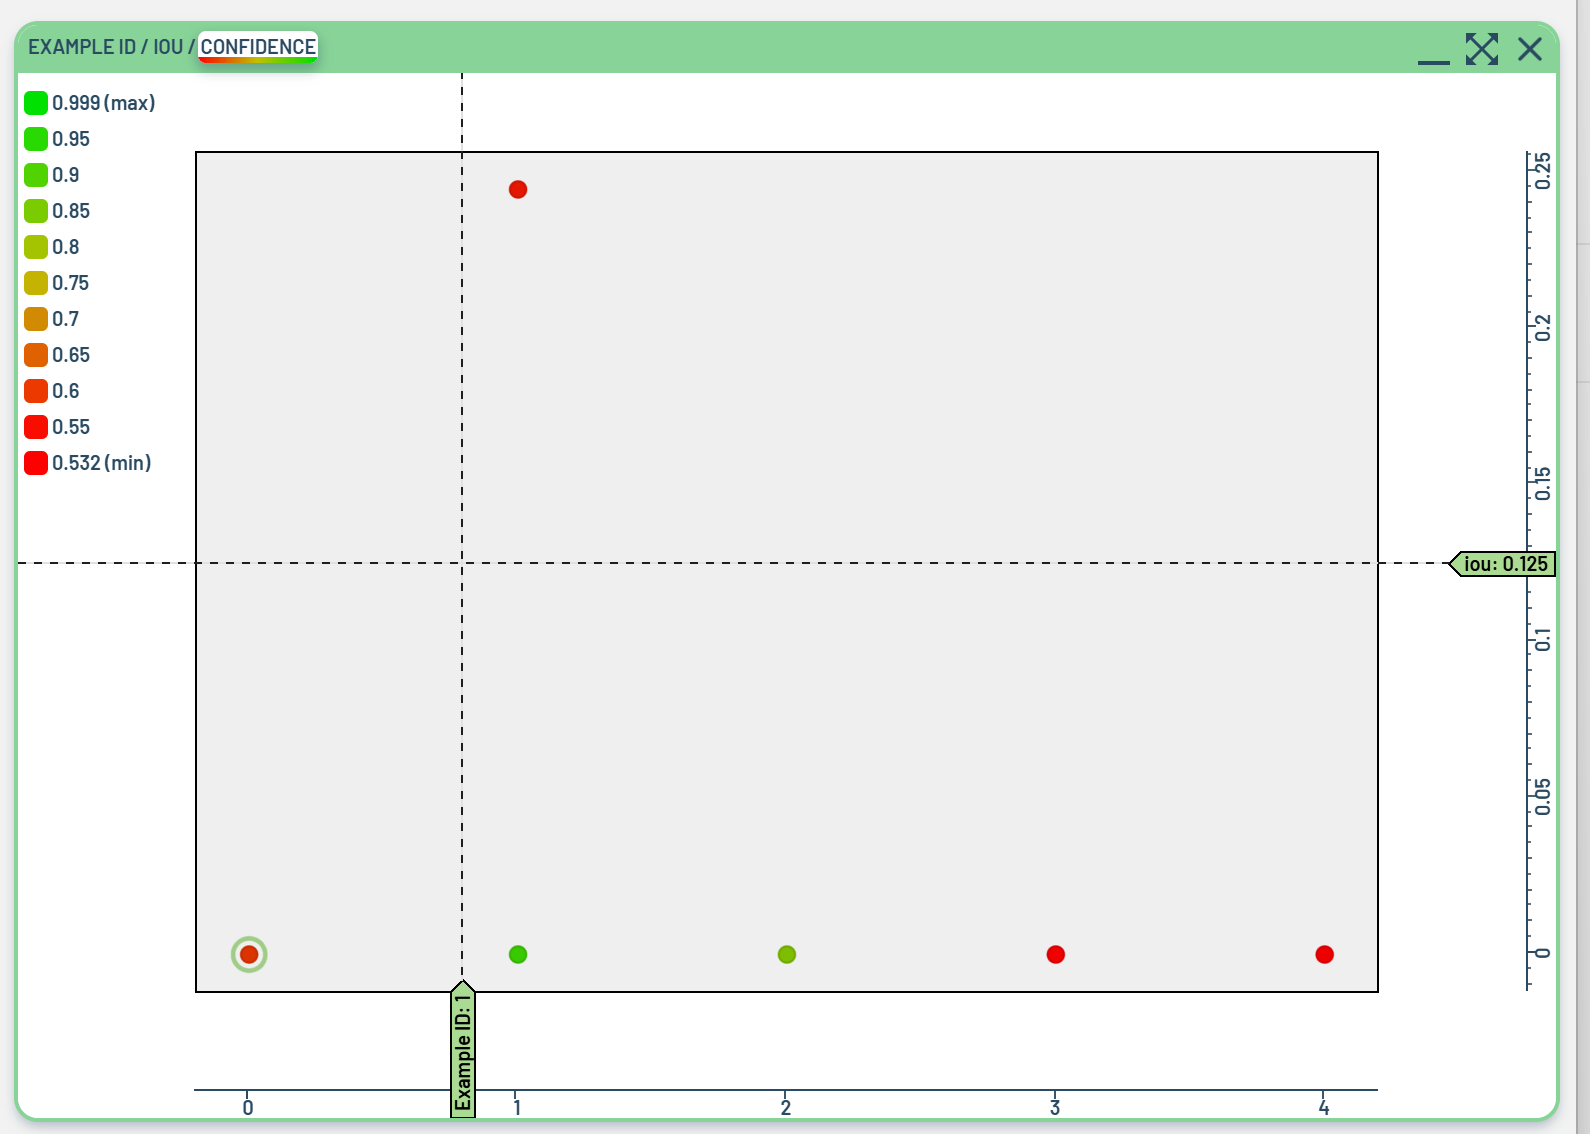
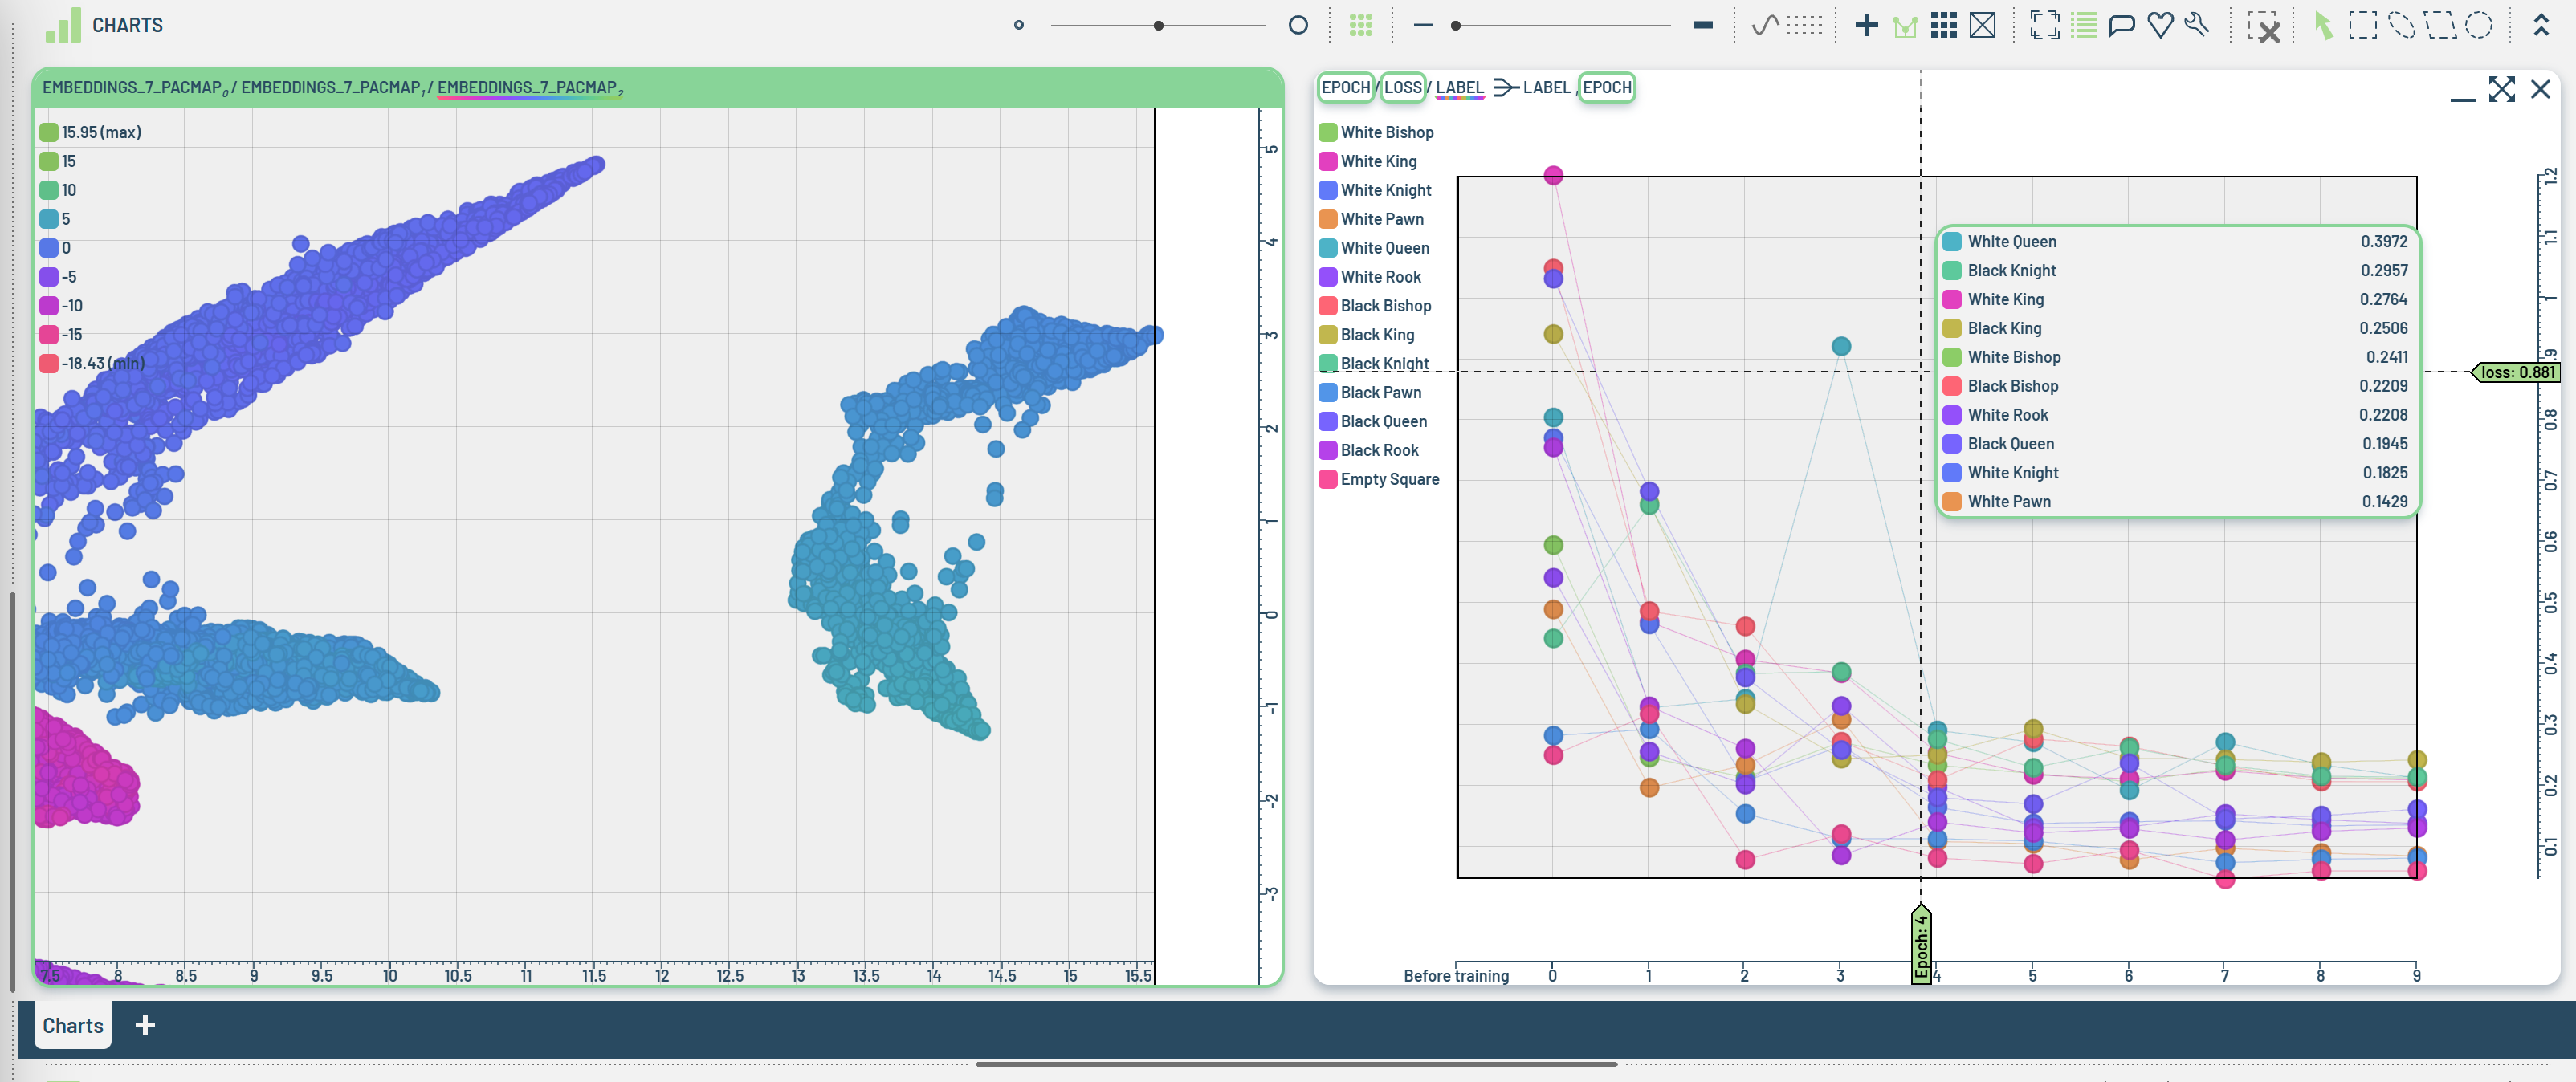
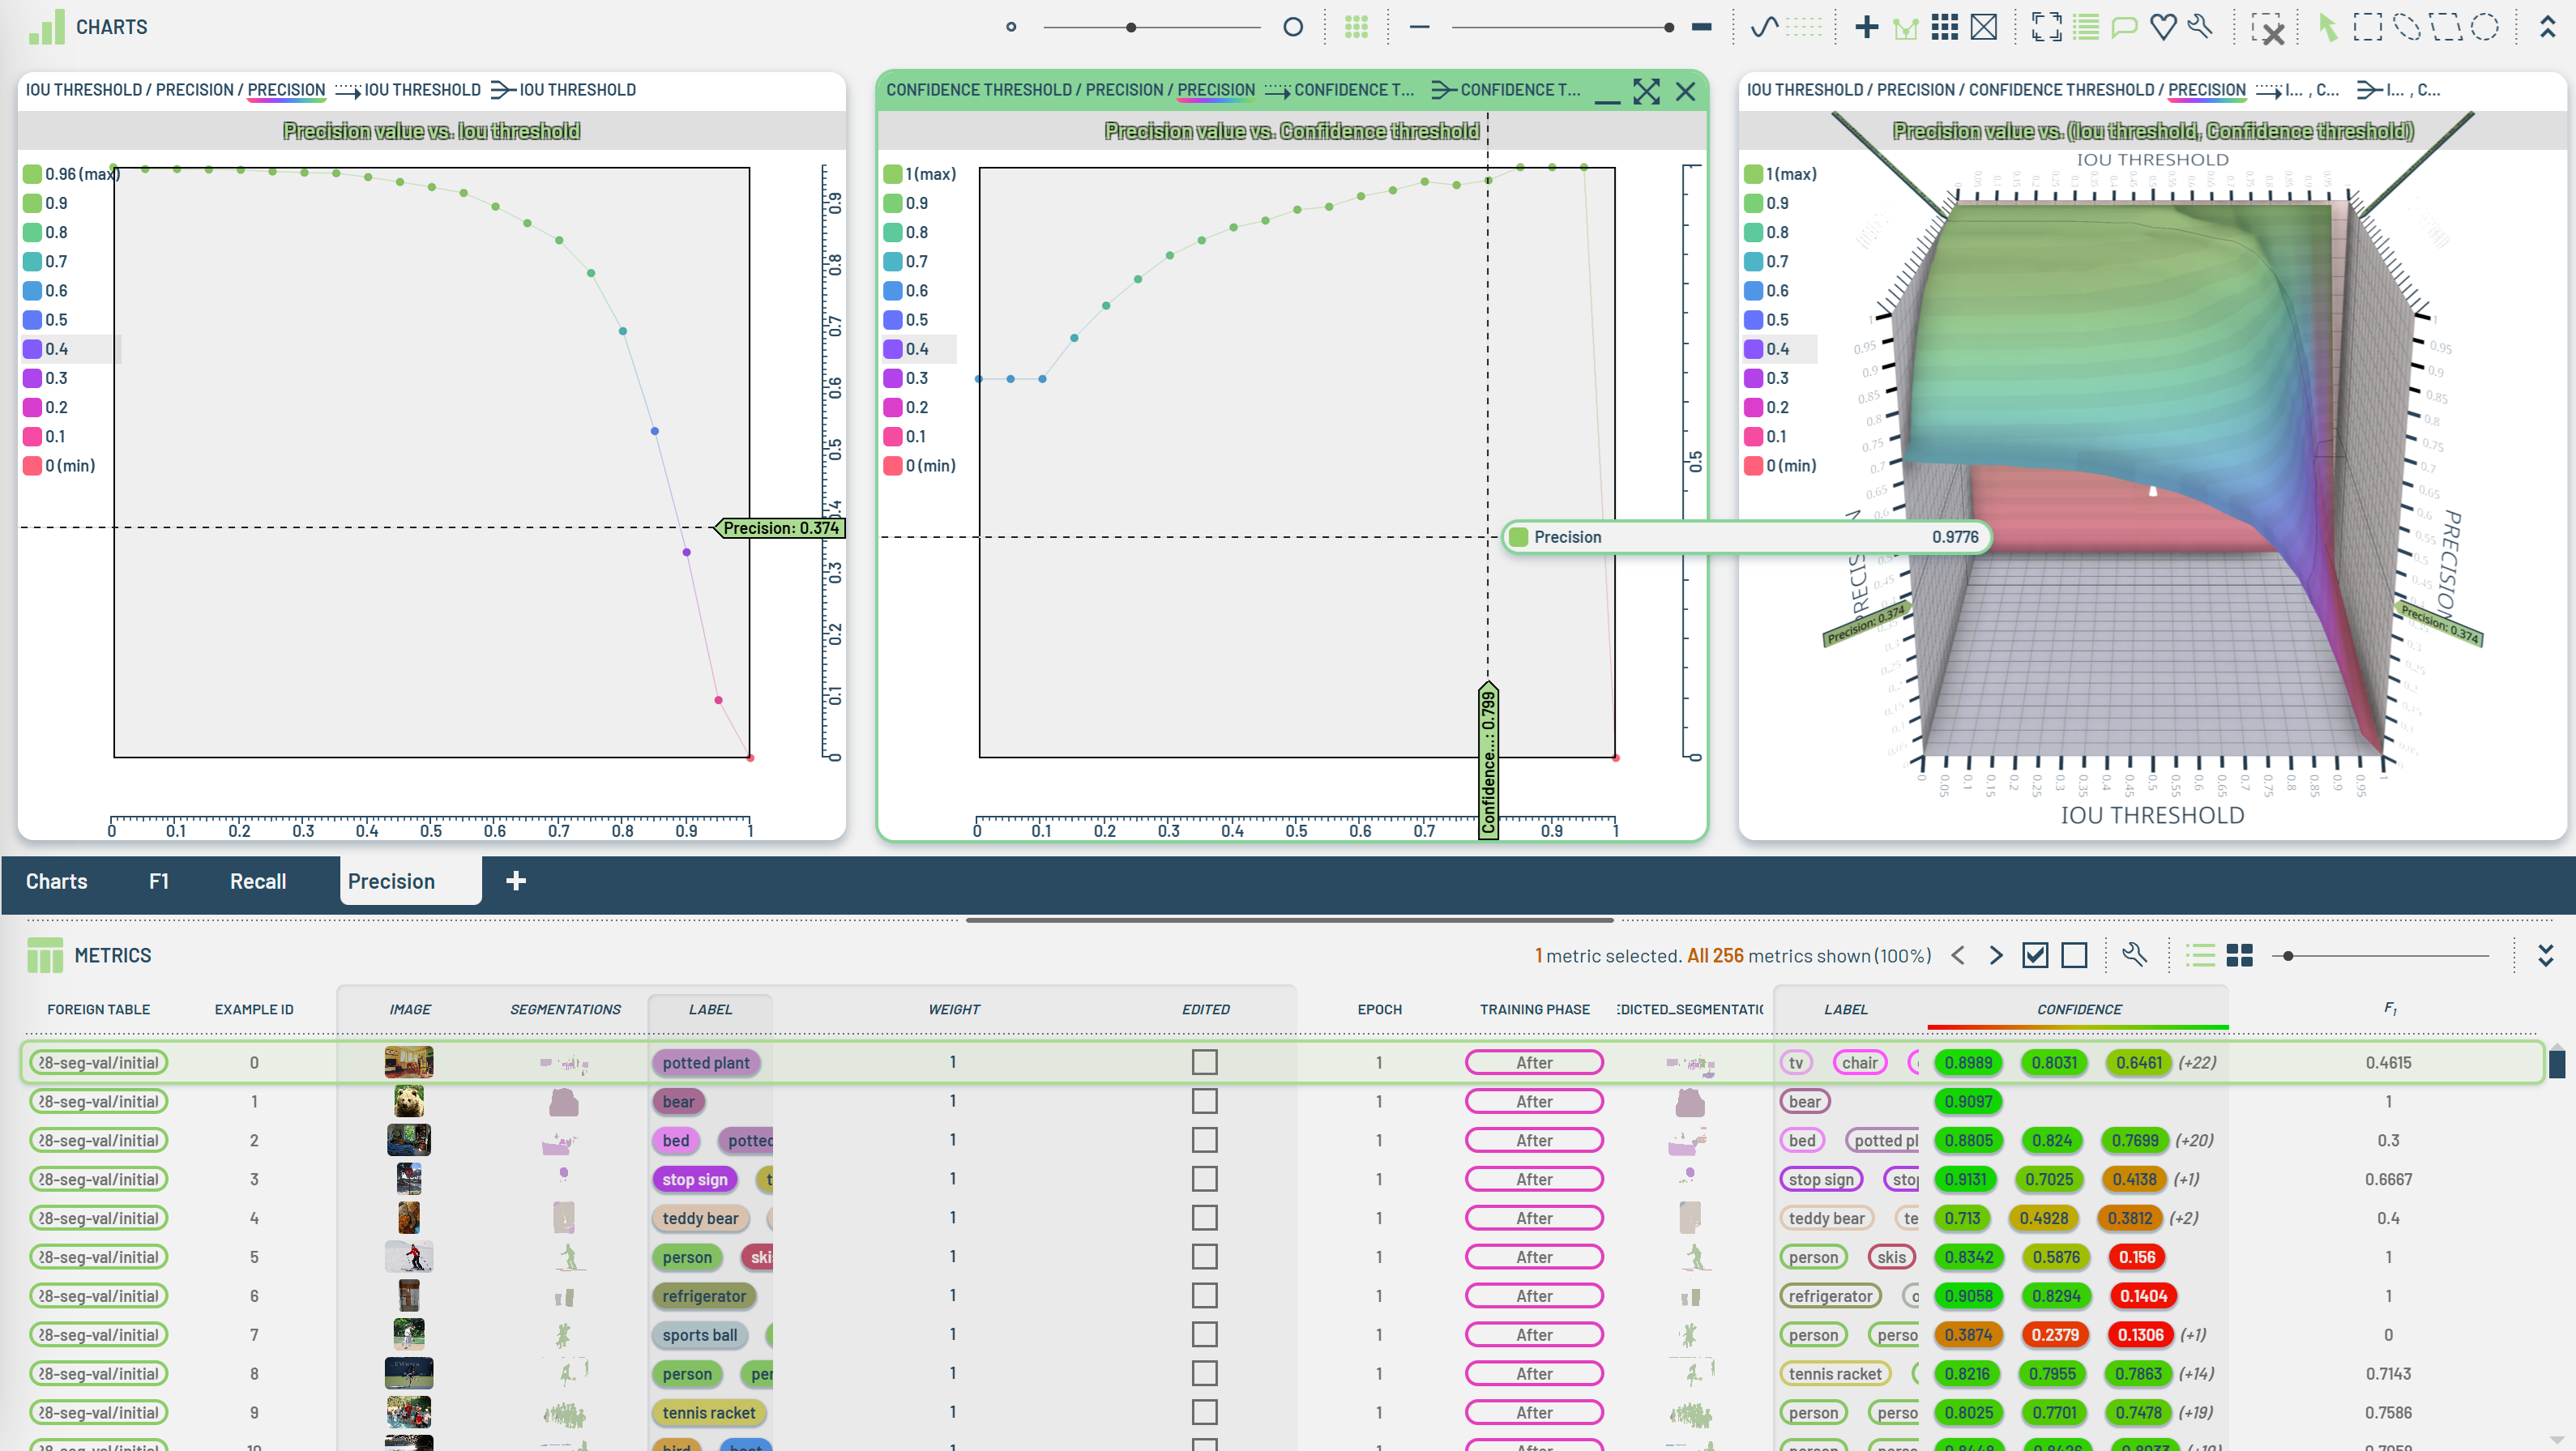
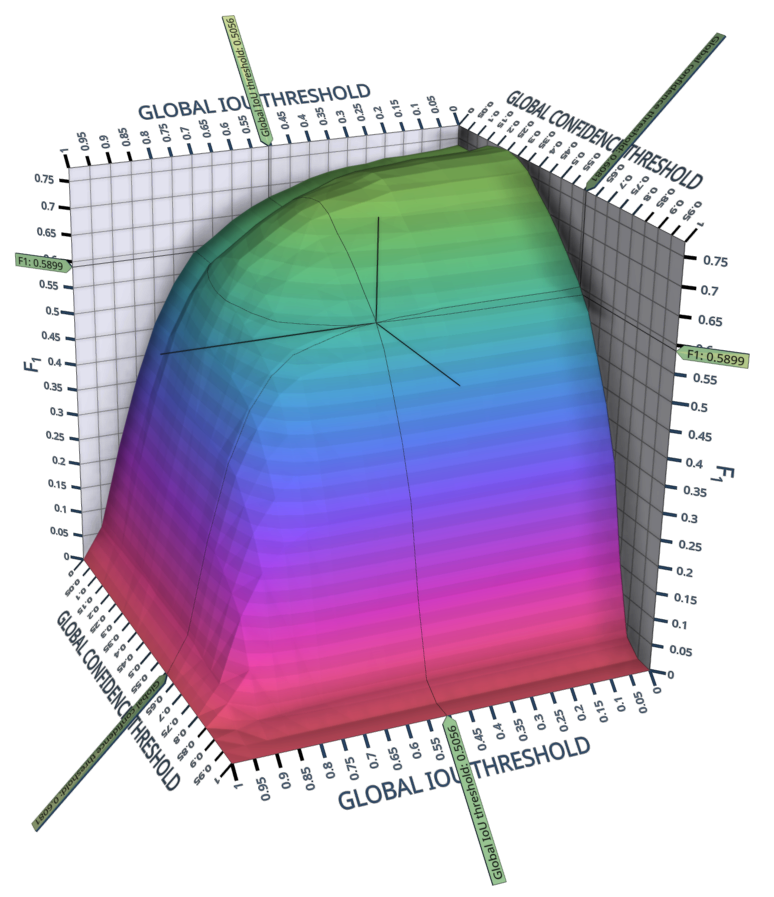
[14316] Chart how computed values (F1, recall,…) change across IoU and/or Confidence sweeps
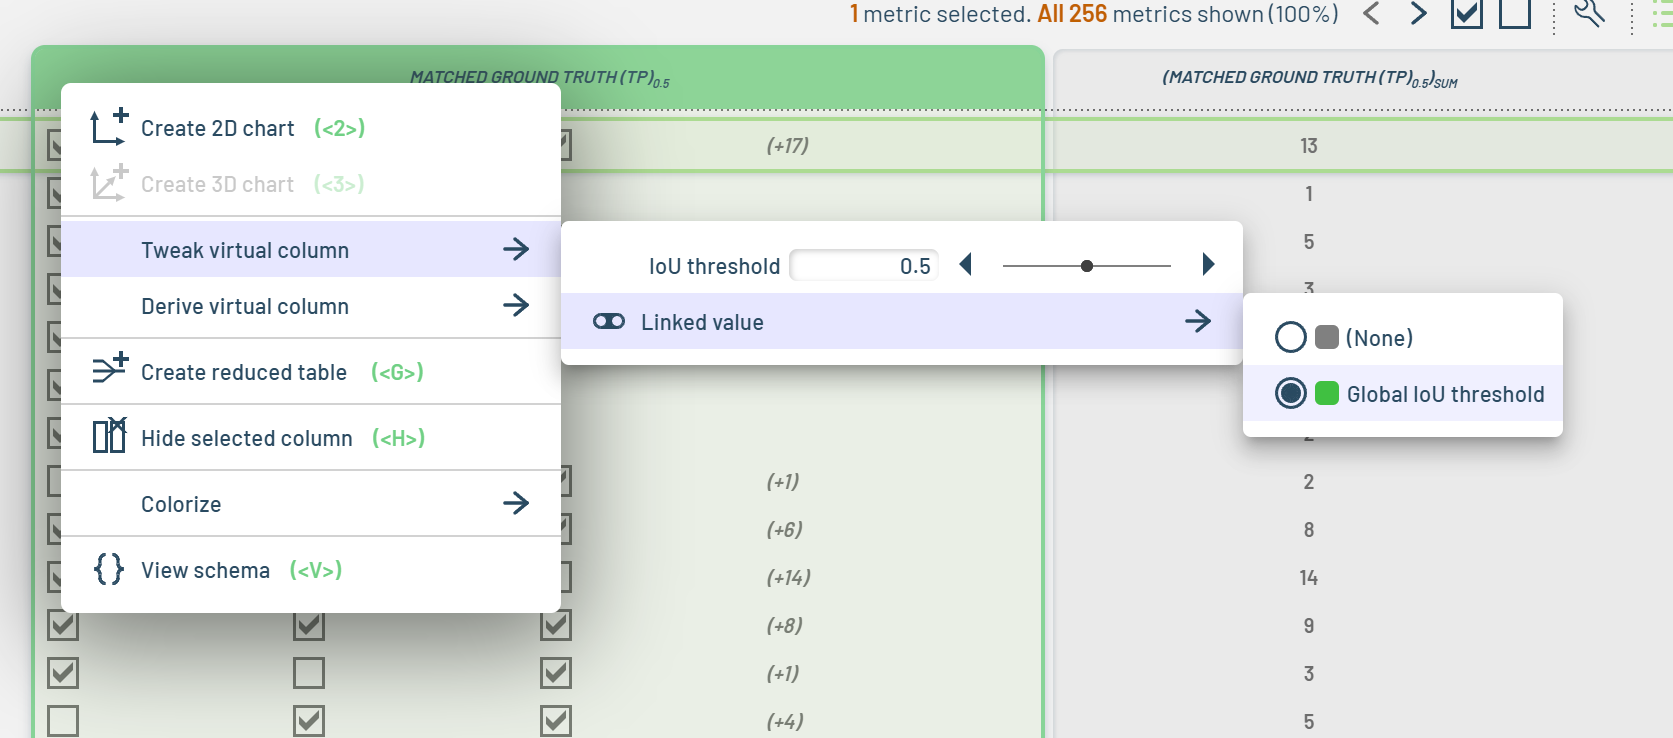
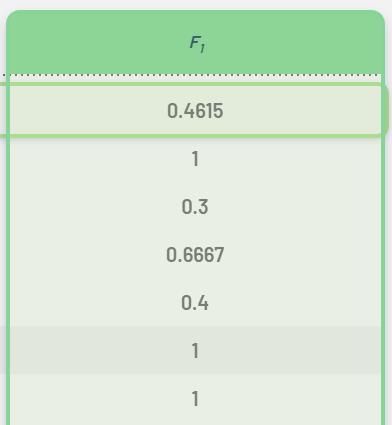
Some operations (e.g. F1 between predicted and a ground truth elements) can be tweaked using the context menu. The values are by default connected to global variables (e.g. “Global IoU threshold”). Within the Table, these values are a single number per table row:
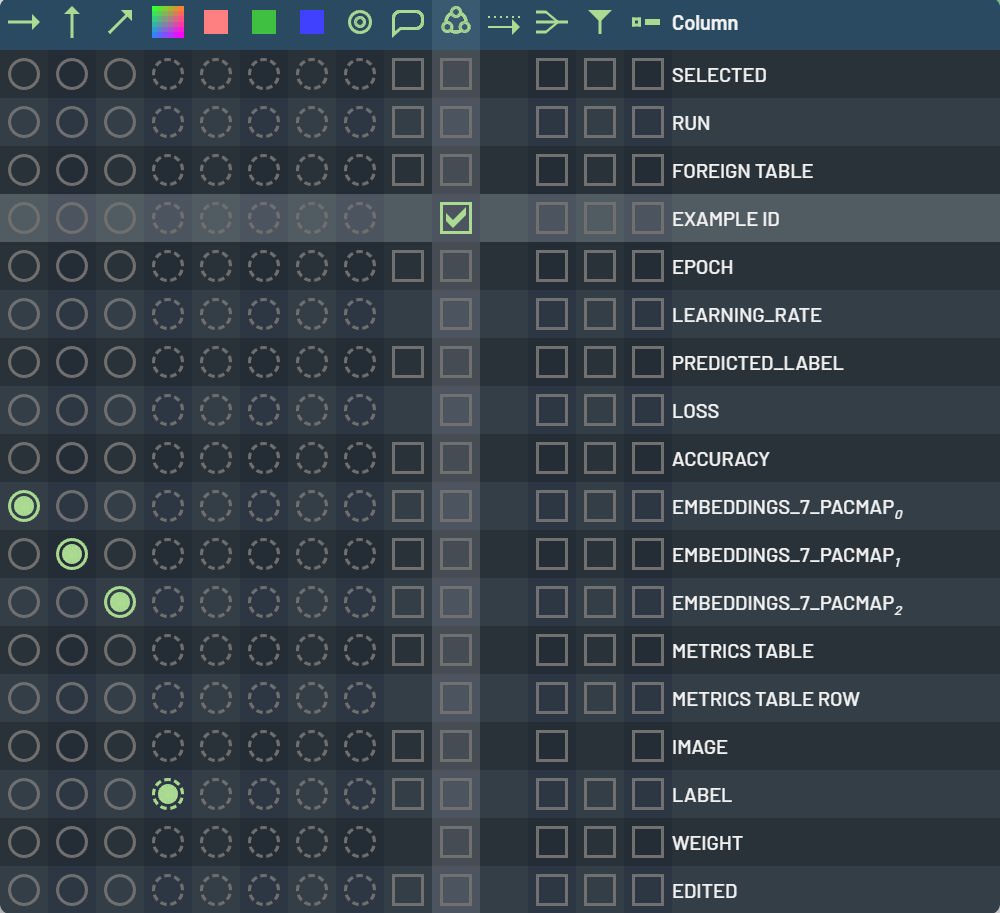
However, one might want to visualize how this value would change if one of the global variables swept across their possible value range. This can be configured using the Tweak-selected-chart dialog (invoked by the ‘wrench’ icon on the main toolbar when a chart is selected). Notice the new “Iterate-over” column highlighted here:
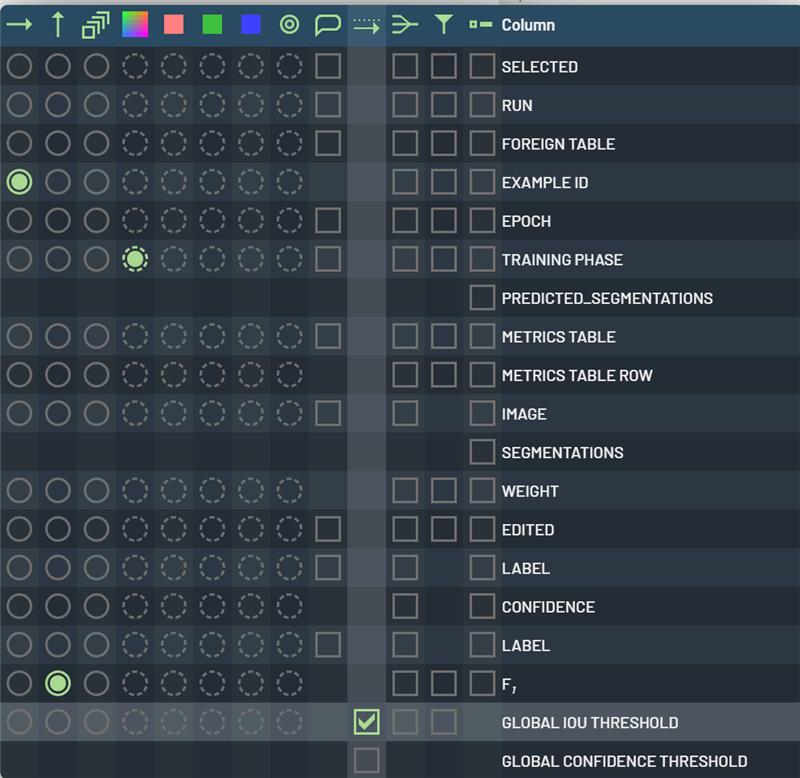
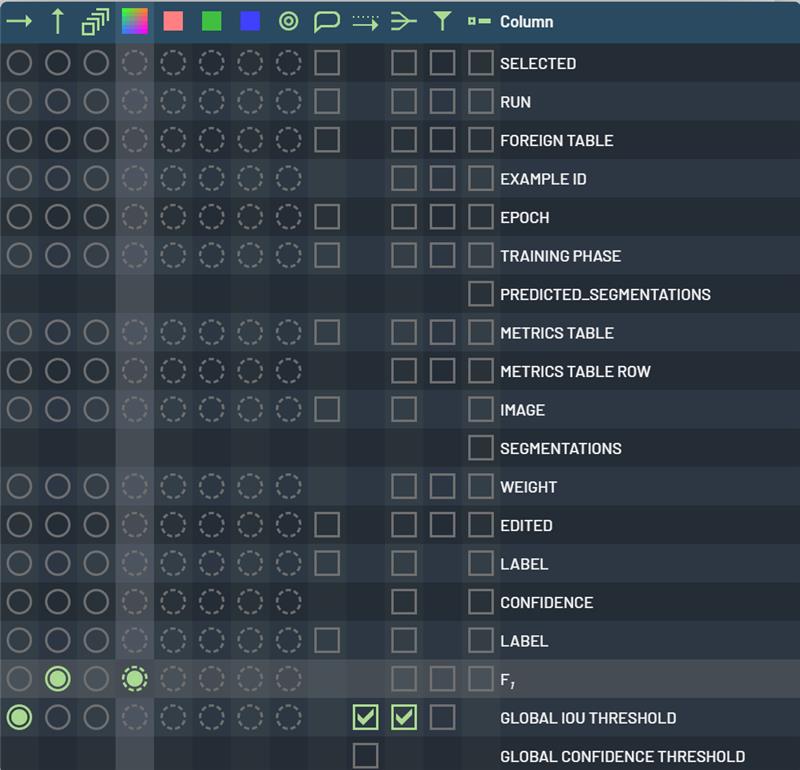
Checking the highlighted box essentially says “unroll all dependent data for each possible value of this” (currently, the IoU thresholds steps by 0.05 increments, resulting in 21 values). Initially, this “exploded” each F1 value into 21 different points. While this could be interesting in it’s own right, a typical use case would be to BOTH plot the sweep value along one dimension, AND reduce on the sweep value (so as to get a single aggregated value). Using this setup…
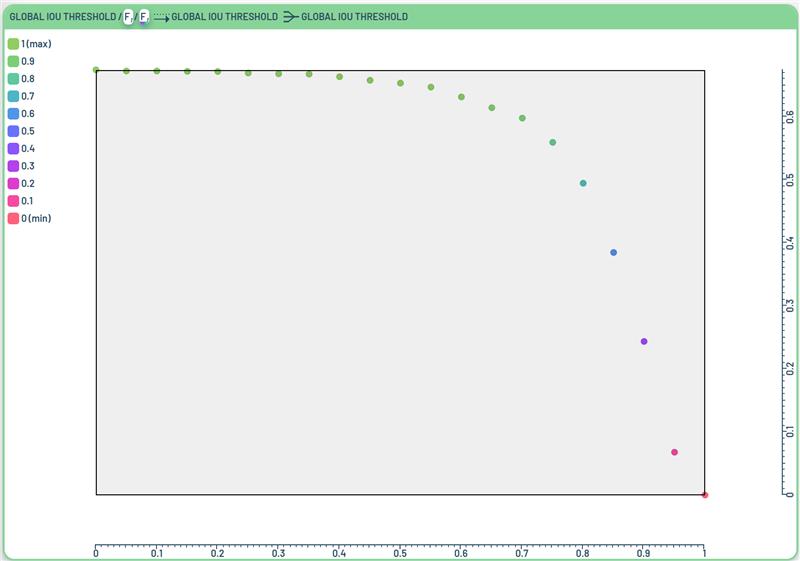
… we get a sweep chart like this:
Made it so that the shared cursor includes intersection with triangular shape geometry (when any present)
Enhancements and Fixes
Colored Commit and Discard buttons green and red, respectively, to make their meaning more obvious
Implemented minor optimization of rendering of images in 2D charts
Fixed regression where the Log window was not sorted correctly by default
[14485] Fixed a potential crash on mouse down
[14494] Fixed a glitch where the Table lineage display was wiggled when zoom 110%
[10099] Fixed a bug where the favorite button was not visible in context menus when the property name was too long
[14614] In ‘Accept predictions’ dialog: when showing approximate numbers, show next “round” number (e.g. 4584 -> ~4600)
[14455] Fixed a rendering bug when hovering over a BB with opacity < 1
[14669] Made it so there is more descriptive undo/redo text when accepting predictions
[14681] Handle cases where mode is set to “Paint new bounding box” but there are no bounding box columns
[14685] Fixed a glitch where the label display was not updated immediately when changed in context menu
[12658] Made it possible to show columns for nested Run parameters
[14740] Fixed a glitch where lines between partially-filtered-out joined points were not always visible
[14742] Removed obsolete, order dependent implementation of OperationIoU
[14763] Fixed a bug causing “inverse” operations not to work
[13771] Fixed an issue that could cause vertical offset/wrap around to the bottom of the screen
[14796] Made some improvements so that newer GPUs are detected with high tier for render settings
[14802] Fixed an issue where class count was not available in the value map dialog in some cases and classes could not be deleted
Known Issues
When renaming a Run in the Dashboard, the old name is sometimes still shown alongside the new name in the Table panel for a short time.