How to use filters
All columns in a metrics/example table have a corresponding filter widget in the Filters panel. The filter widgets include sliders, check boxes, and search boxes, depending on the types of the column values. If a column is not filter-able such as an image column, the filter widget is displayed as a title bar only.
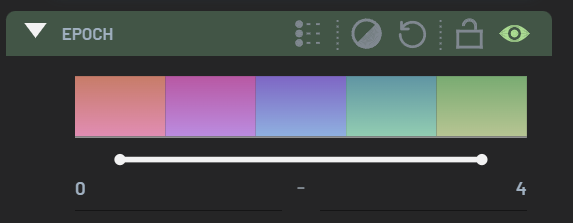
Each filter widget has a set of tools on its title bar. From left to right, they are:
Collapse filter: Collapse the filter widget
Show/hide filtered-out points: Show/hide the filtered-out data points in grey in charts; default
hideInvert filter criterion: Invert the applied filter criterion
Reset filter: Reset the filter
Lock: Lock the filter such that
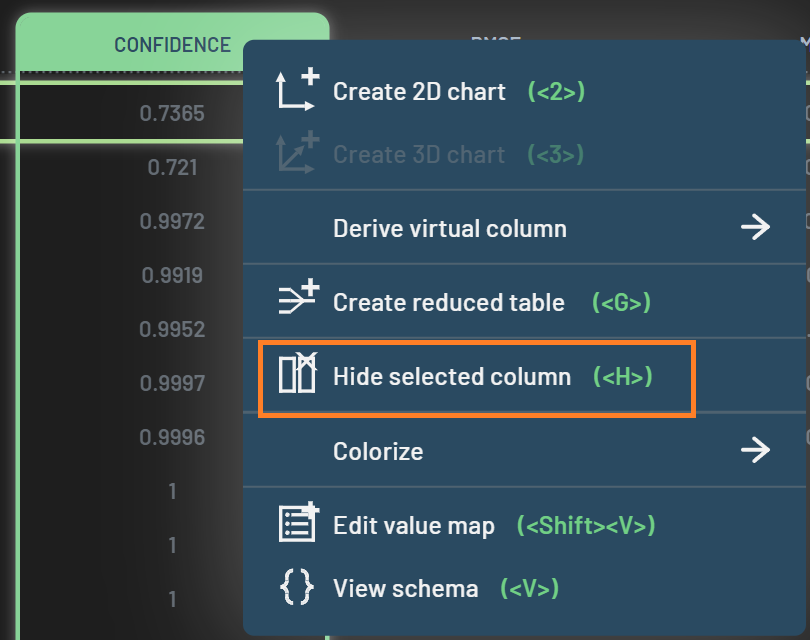
clearing all filterswill not affect this locked filterShow/hide column: Show/hide the column in the metrics table

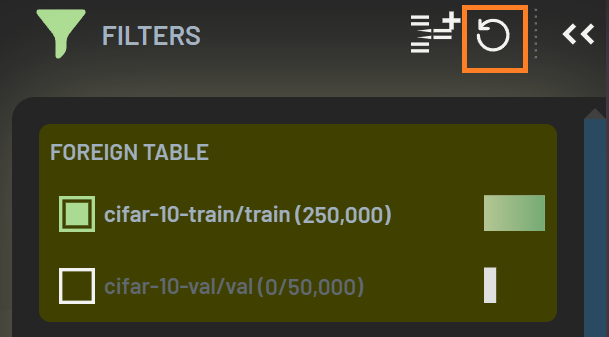
When a filter is applied, the background of the filter will turn to yellow, and the global Clearing all filters icon
will appear on the title bar of the Filters panel. You can click it to clear all applied filters except
those that are locked.
Shortcuts: D vs CTRL+D
D: Clear all filters (except those that are locked) and polygon selections
CTRL+D: Clear only polygon selections

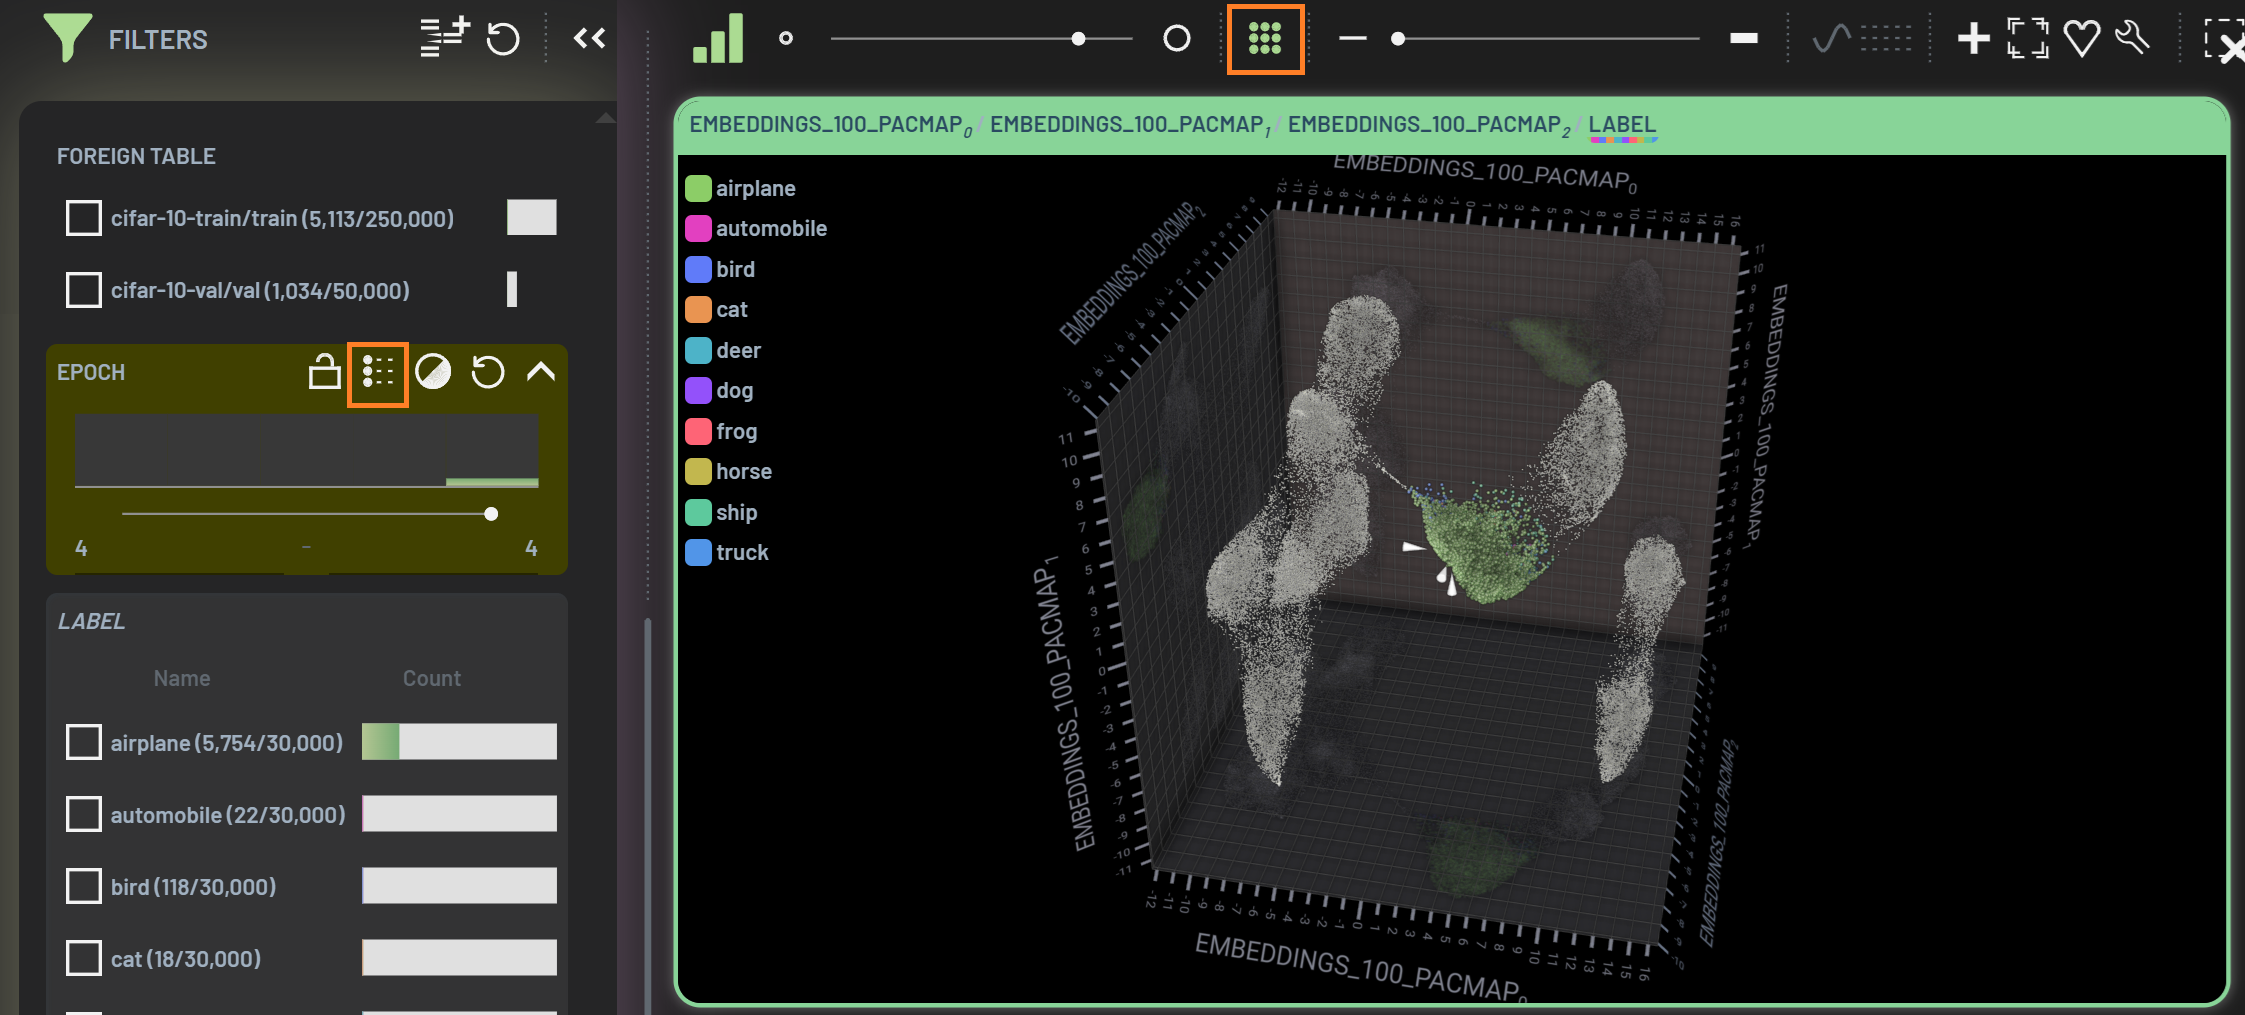
The Live filter setting (lightning icon) allows you to turn on and off the live filters. The icon will appear at the title
bar of the Filters panel when some filters are applied. When the Live filter is on (shown as a green
filled icon), the applied filters will be dynamically updated whenever any values related to the filters have been
changed. For example, with the unmatched prediction (FP) filter applied, all the unmatched predictions will be
filtered in. When you accept an unmatched predicted bounding box (BB) into a ground truth BB, this predicted BB will no
longer be unmatched and this image along with its BBs will be filtered out. If you want to do further fine tuning on
this accepted BB, you will not be able to as it is filtered out. However, if the Live filter is turned off (no color
filled icon), this image and the accepted BB will still be present (not be filtered out) despite that this predicted BB
no longer satisfies the filter. This will help you “lock in” the image and the accepted BB so that you can do some fine tuning if you
want. This functionality is very useful when it comes to editing BBs and segmentation masks. When the Live filter is
turned back on again, all filters will be automatically refreshed to its current state.

