3LC Dashboard Version 2.5
2.5.14
Features
[13991] Added “Object detection basic insights tour” workflow to provide a short tutorial for bulk assigning predicted bounding boxes as ground truth bounding boxes
[14119] Added “Properties of bounding boxes” workflow to create virtual columns to show some useful properties of bounding boxes
Enhancements and Fixes
[14431] Fixed FP calculation by disallowing matching the same ground truth BB to multiple predicted BBs
[14387] Fixed an issue where double-clicking a value in the Filters panel did not select the minus sign if present
[14448] Fixed an issue where drop operations were unavailable for some chart dimension name areas
[14462] Made so that any column with more than four components is now treated like an array rather than a fixed-component-count vector
2.5.13
Features
[14124] Added “Generate FN/FP/TP columns” workflow to create columns that indicate false negatives, false positives, and true positives based on ground truth and predicted bounding boxes
Enhancements and Fixes
[14284] Updated
threedependency from version 0.126.1 to 0.170.0, and updated related dependencies for compatibility[14327] Fixed an issue where images were sometimes not rendered in modes other than the default
[14394] Made it so that read-only BB attributes are not shown in the layer widget
2.5.12
Enhancements and Fixes
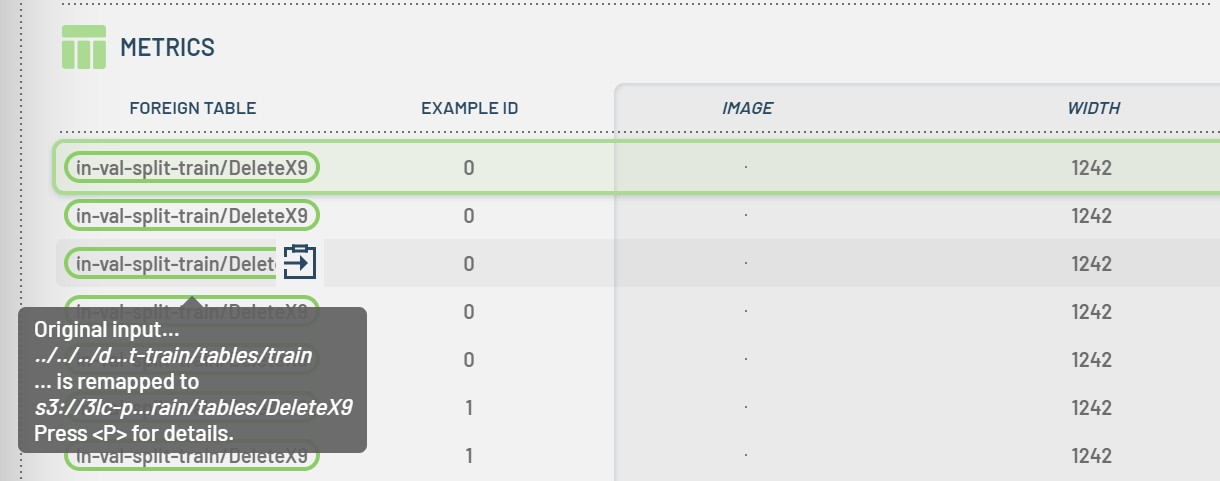
[11687] Made it easier to tell when the Table being shown is not the original Table the data was trained one, usually because revisions have been made and the latest revision is the one being shown
When opening a Run where one or more Tables are remapped to show newer versions, a blinking yellow dot will now be shown next to the Run name. Hovering over it shows a descriptive tooltip. When opening the Details dialog, the dot will disappear. There is also a setting to disable this display.
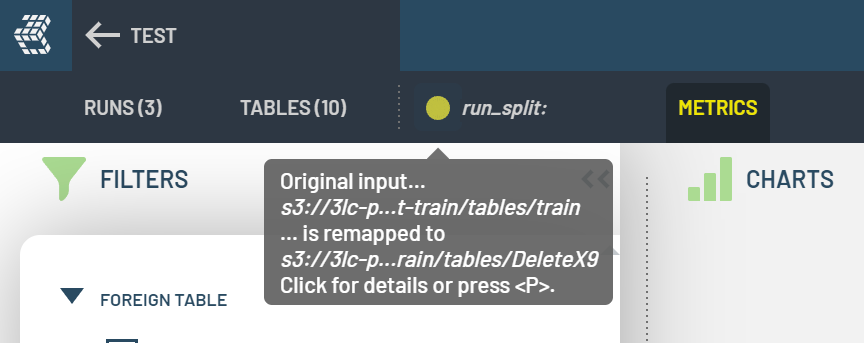
In the metrics Table display, the effective input Table URL is now shown. It has a tooltip describing the new and the old value.
[14312] Tweaked the Run details dialog to show descriptive text under each heading and move “Run input Tables” section toward the top since it contains the most relevant, tweakable widgets
[14308] Fixed a bug where the filtered index column value in charts would be incorrect and not match the value from the column in the Rows view
[14296] Correctly set default values for array properties (e.g. embeddings) when converting predictions to ground truth BBs
[14299] Made a couple of minor optimizations related to showing context menus and rendering image borders
2.5.11
Features
[13988] Enabled the ability to mark workflows as favorites such that they show up in the list before the other available workflows
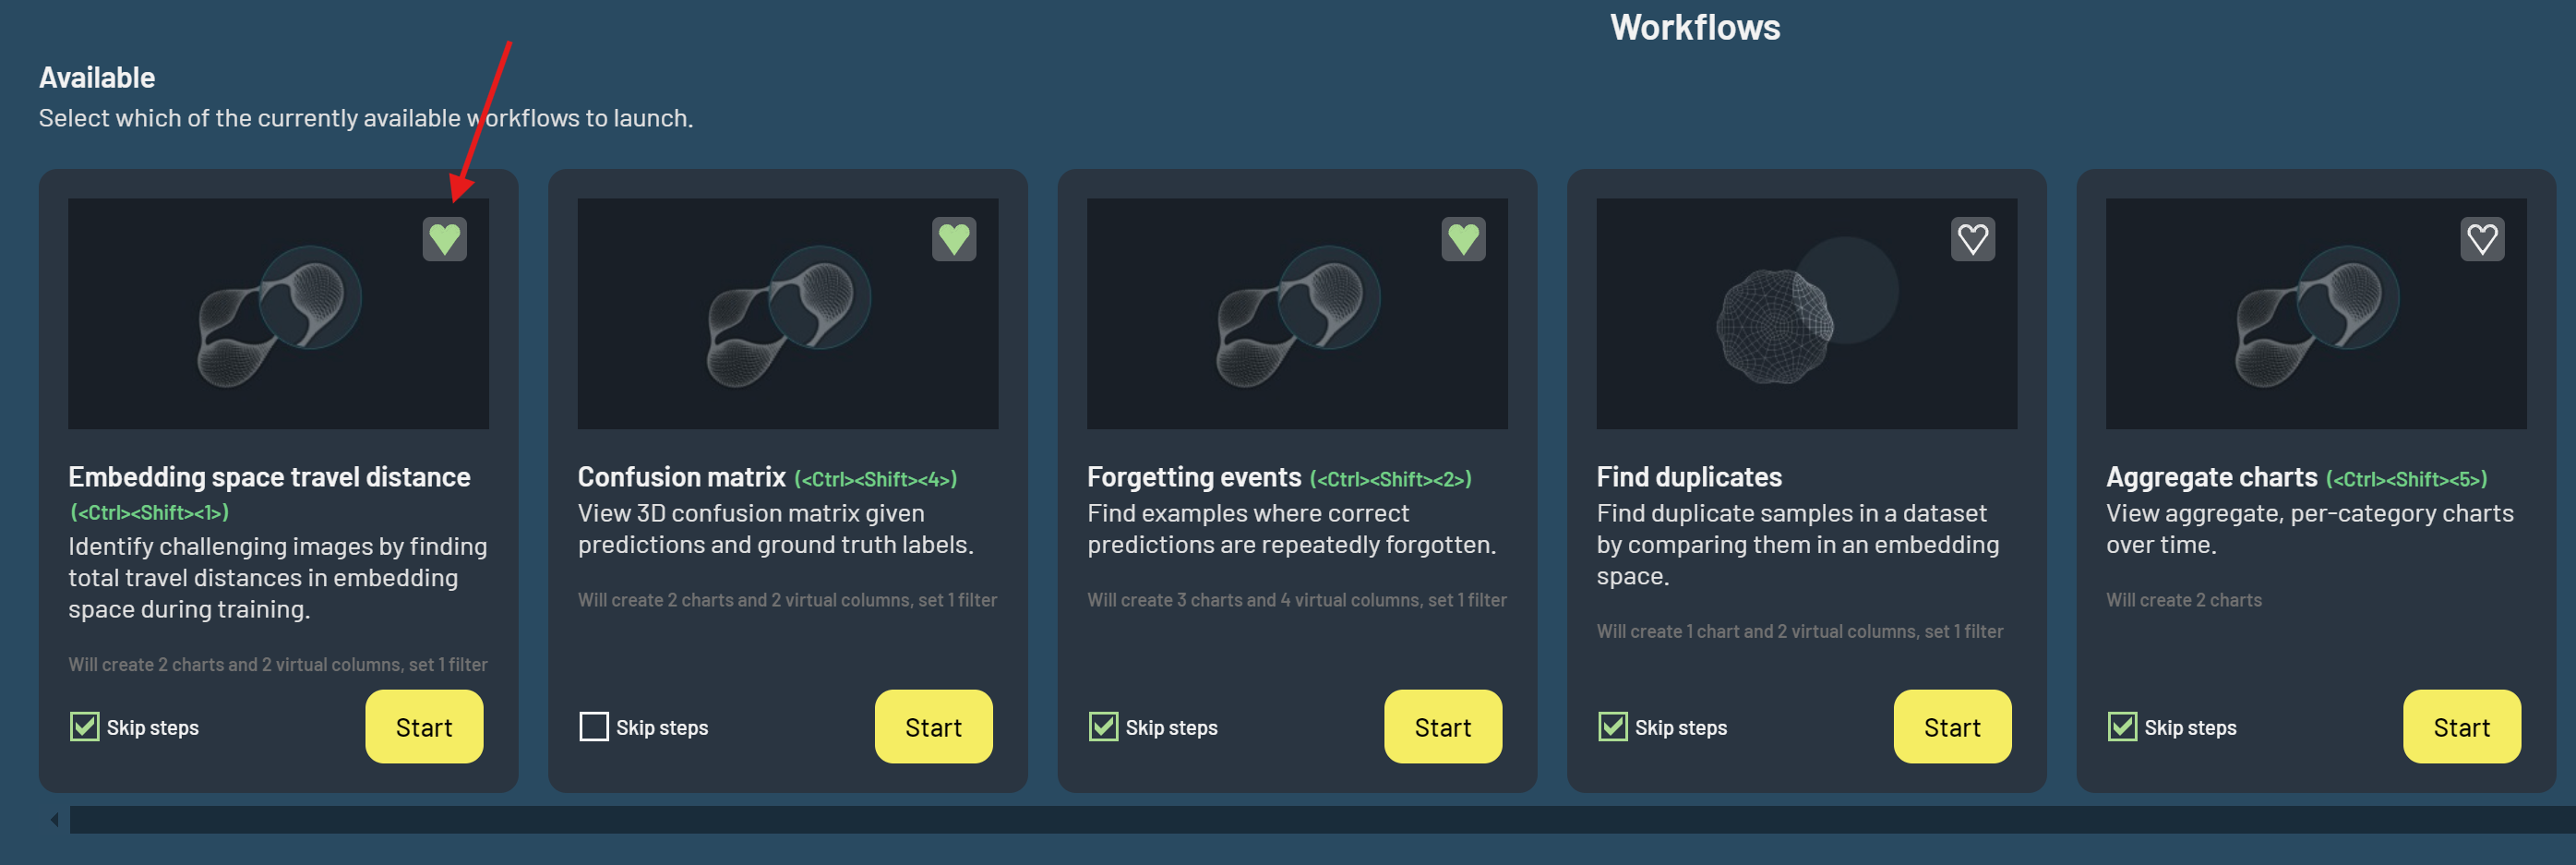
[13987] Made it so that when opening a Run, the workflow dialog pops up automatically by default if there are any applicable workflows. This behavior can be suppressed by disabling it in the workflow dialog that automatically pops up or in an equivalent option in the settings dialog.
[13993] Added ForgettingEventsWorkflow to find examples where correct predictions are repeatedly forgotten, along with supporting operations, including comparison operations against constant float values, OperationAggregate, and OperationNegative/Positive
[14193] Added ShowBbMatchesWorkflow that creates bounding box views colorized by whether ground truth and predicted bounding boxes match each other
[13994] Added NdTravelDistanceWorkflow to identify challenging images by finding total travel distances in N-dimensional space during training. Distances are computed based on all columns selected when the workflow is invoked.
[13994] Introduced a general mechanism where workflows can bind to input data through the currently selected column(s)
Workflows could previously indicate whether they wanted a column alias to resolve (i.e. bind) to a single value or any number of values. This is now changed to a min/max count instead.
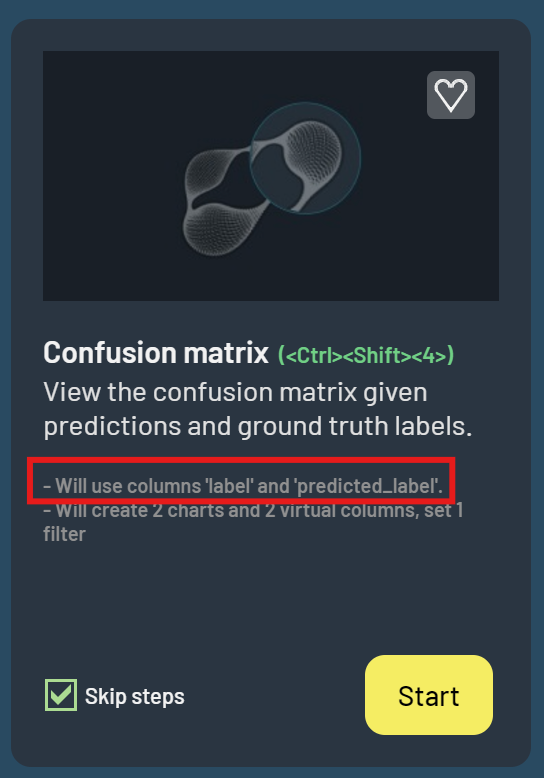
When a workflow is enabled, the Workflows window will now display which columns it will operate on
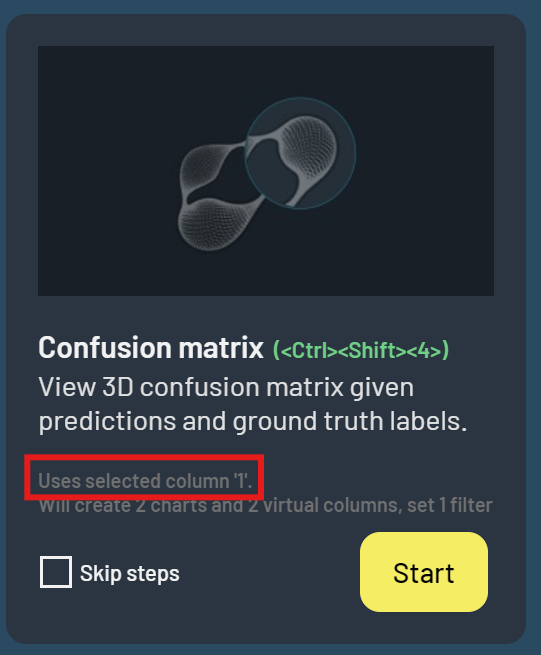
When too many columns were available, the framework would previously pick an arbitrary one and use that. For instance, the EmbeddingSpaceTravelDistance would select a single embedding column and ignore the others when multiple were available. With this PR, the Workflow would instead be disabled due to this ambiguity, and display an explanation.
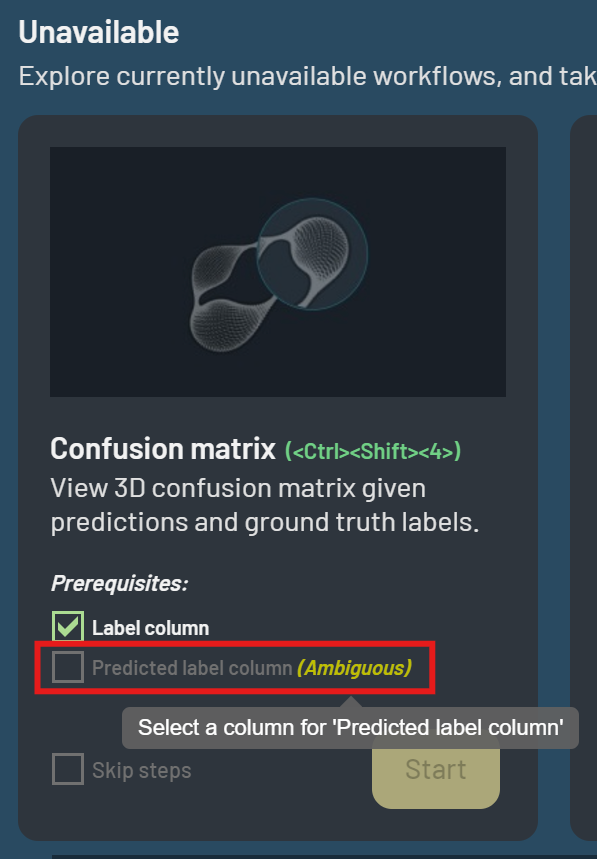
However, if one or more columns are selected which will resolve the ambiguity, the Workflow will be enabled and bound to those properties.
To indicate the relationship between the selected columns and the enabled Workflows, the following mechanisms are in place:
The Workflow list window indicates the binding
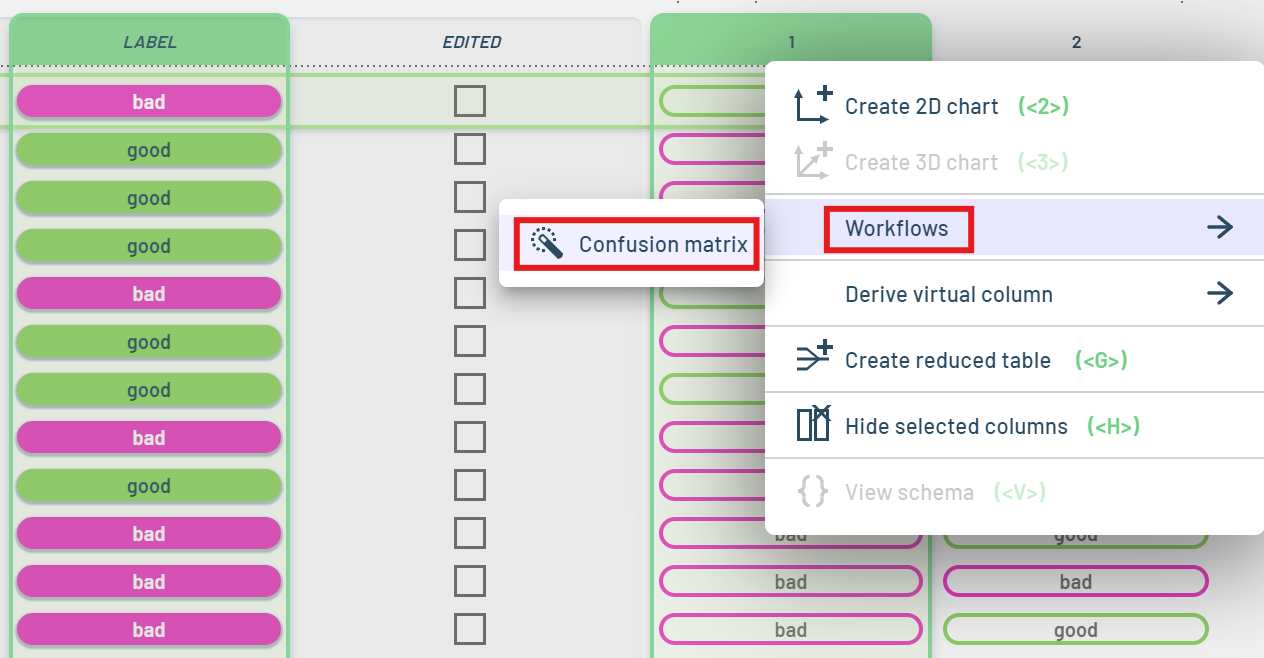
The Workflows which are enabled due to the selected columns ALSO appear on the Columns context menu itself
When a workflow tries to bind to an N-component property, the mechanisms above will now automatically package multiple selected components into a compatible, zipped column when possible. This allows e.g. the 2D or 3D embeddings workflow to be invoked from 2 or 3 selected scalar values, which are then automatically bundled.
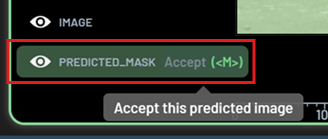
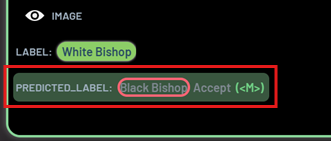
[14159] Made it possible to accept predicted segmentation masks as labels, including support for using M as a keyboard shortcut to do so (also supported for accepting predicted scalar values)
[14208] Added keyboard shortcuts O to toggle overriding image resolution and Ctrl+O to cycle through image display modes (nearest neighbor/bilinear/bicubic)
[14259] Made it possible to toggle display of filtered-out bounding boxes using a context menu on the bounding box layer widgets or keyboard shortcut 1
Enhancements and Fixes
[14006] Fixed an issue where the Dashboard object service URL could revert to the default even though it had been set through the URL query parameter
[14059] Optimized performance of cursor readout on reduced charts
[14015] Fixed a potential crash due dereferencing an undefined variable
[14111] When clicking on points made visible by the ExtendWorldLines functionality, select the originating table row
[13997] Made it so the text “FINISH” / “NEXT” in the workflow dialog is clickable
[14107] Fixed a regression where the confidence filter was not set as instructed in the add new label categories workflow
[13998] In the Filters panel, only show the open eye icons for visible columns on mouse over
[14004] Fixed an issue where it was sometimes not possible to edit a new bounding box when accepting predictions using M
[13645] In the Filters panel shown for Runs, only show the defined constants for the selected Project instead of showing all constants across all Projects
[14131] When clicking on a point representing an array selection, jump to that BB (when relevant)
[14165] Fixed a regression where chart custom annotations did not keep edited text
Fixed glitch when dragging onto table title components
Fixed glitch where read-only segmentation mask widgets would still display a paint state and incorrectly capture J keyboard events
[14206] Fixed an issue where locking a filter in one Project/Run would keep it locked in the next one opened
[14207] Made it so Rows panel does not switch out of picture mode during workflows
[14209] Fixed an issue where data for only the first metrics tab would be loaded for some Runs
[14205] Made it so the cursor used for painting bounding boxes more clearly indicates its intent with a + sign
[14205] Enlarged the area in which mouse-pointer-to-border interception is interpreted for bounding boxes to make it easier resize them
[14231, 14257, 14262] Fixed several issues with adding/editing BBs in a Table containing BB embeddings
[14168] Made it possible to create a “Filtered index” column that assigns a number indicating the row index in the filtered/sorted table, in contrast to the existing “Global index” column (previously called “Index”) that relates to the row index in the unfiltered table
[14228] Only show the red banner error about being unable to connect to the 3LC service if we get back an error/abort for a request and we have never connected or the connection timeout has passed. This should help avoid showing the banner when there are temporary issues connecting to the service.
[14260] For long column names that do not fit in the tweak chart dialog, show the full name in a tooltip
2.5.10
Enhancements and Fixes
[13990] Aggregate charts workflow now plots train and validation curves independently
[14055] Fixed an issue where adding a class and then removing it stayed as a pending edit and committing created an EditedTable with no changes
[14093] Fixed a regression that caused charts toolbar boolean buttons to not work correctly
2.5.9
Enhancements and Fixes
[13909] Disabled debug asserts in production build, which was always the intent but regressed some time back
[14038] Made overall performance optimizations
[14042] Fixed an issue where changing selection mode while paint polyline was in progress did not work correctly
Fixed a glitch where the ‘hand’ icon (from the select-at-point controller) would incorrectly override the paint-region-icons when hovering over a point
[14054] Fixed a bug in table header color range display
Show hover line on color bars
[13986] Fixed a glitch related to the Tweak-charts-window
[14046] Fixed a crash by avoiding loading fixed-sized parquet arrays with more than 50 elements into memory and showing placeholder text instead. This could happen e.g. when embeddings were created but not reduced in the original table.
Known Issues
When renaming a Run in the Dashboard, the old name is sometimes still shown alongside the new name in the Table panel for a short time.
Using 3LC dashboard with the React Dev Tools browser extension enabled might cause the browser to accumulate memory over time and eventually crash. If you experience this issue, we recommend disabling the React Dev Tools extension while using the 3LC Dashboard.
2.5.8
Features
[13696] When selecting a column in the rows panel, force the corresponding filter widget into view
[13626] Added the option to filter on values from table cell context menus
[13580] Added the option to copy values from table cell context menus
[13958] Made it so that when performing on-the-fly reduce, bool columns are made effectively continuous
[13790] Added OperationExpConstant with base that can be tweaked
[13862] Added OperationRandom with seed that can be tweaked
[13896] Added OperationFilterOnEnumSet with ability to tweak the set of enum values to filter on, which can also then be used with additional operations to e.g. count the number of occurrences of particular enum values
[13896] Added OperationFilterOnNumericRange with ability to tweak the range of numeric values to filter on
Enhancements and Fixes
[13983] Reduced memory consumption accumulating over time
[8604] Optimized several operations to improve performance
[13739] Fixed an issue when encountering a NaN for BB image size X/Y
[13708] Fixed an issue leading to a confusing default filename being used in a table URL
[13609] Fixed a bug with filtering BB IOU at 1
[10844] Fixed a bug causing submenus to close when moving the mouse over a scrollbar
[13824] Made it possible to display e.g. Run->last_modified as a virtual column
[13827] Fixed a bug with reducing on an image column
[13564] Clarified instructions on confusion matrix workflow
[13832] Fixed a bug that caused favorite charts to sometimes be created multiple times
[13707] Ensure favorite charts are not created by workflows for identical charts that already exist
Ensure virtual columns are not created by workflows if they already exist
Disable workflows that will not have any effect (i.e. all virtual columns or charts are already present)
[10955] Fixed a bug that sometimes caused an error with tooltips in project runs charts
[13835] Made it so “Show” is not filterable for runs page
[13844] Made it so only filtered-in array elements are shown in table cells
[13894] Fixed an occasional crash that could rarely happen when pressing F
Indicate when subset tables use inverted filter criteria
[13728] As a first initiative towards limiting the max memory consumption of the application, limit the number of rows read from a received Parquet file to 5 million (and log a warning if this truncation occurs). Note that when opening multiple Tables or even a single Run, the total number of rows might still exceed this since JoinedTable typically combines multiple parquet tables into a larger effective table. We may need to limit this later.
[13896] Support arrays for OperationZero and OperationNonZero
[13899] Display a warning in the Log window when unable to copy a screenshot to the clipboard
[13899] When reporting errors to the Log window, optionally also show a short message using the Snackbar widget at the lower left
[13898] Fixed an issue where hover state was not respected by legend overlays and several widgets
[13749] Fixed an occasional crash that could happen with undefined array columns
[13195] Removed keyboard shortcuts to delete rows using Delete and Backspace that were relatively easy to accidentally trigger
[13960] Made a fix to tooltips for on-the-fly reduce charts
[13984] Fixed a bug where a filter’s “&” and “invert” state would get reset when resetting another filter
2.5.7
Features
[12987] Made it so there is a single 3LC dashboard at https://dashboard.3lc.ai for all users, removing the former enterprise-specific 3LC dashboard at https://dashboard.enterprise.3lc.ai.
[13480] Improved UX for selection of bounding boxes in charts
Left and Right keys only jump to filtered-in bounding boxes
The left side of the widget for partial selection now shows the bounding boxes as filtered out (sunken), filtered in (grey) or selected (white) dots.
Clicking on an enabled dot will select the corresponding bounding box
Filtered-out bounding boxes will not be selected when selecting BBs using a region tool
Deselect filtered-out bounding boxes when tweaking filter
Show number of selected bounding boxes (when relevant) alongside number of selected table rows
[13581] Pressing A (i.e. “select all”) will now select all bounding boxes if some bounding boxes were selected originally
[13614] Made it possible to show/hide legend overlays in charts by toggling a new button in the toolbar. When legend display is off, hovering over a point will still show the legend for the hovered-over value only.
[13606] Made it possible to rename a charts tab by double-clicking on the tab
[13607] Made it possible to show/hide custom user annotations in charts by toggling a new button in the toolbar
[13736] Made it so that the
detect-gpupackage is updated in each build to ensure the latest GPUs and benchmarks are included when detecting the GPU profile[12987] Added a banner to the top of the Dashboard that can be shown to make users aware of important information and provide links to relevant resources. This banner is now shown where the Dashboard cannot connect to the 3LC service.
Enhancements and Fixes
[13494] Fixed a bug where the visibility icon in the filters panel could get out of sync with the visibility of columns in the Rows panel
[13497] Fixed an issue where co-located data points could be rendered white in charts when they should have been colored in certain cases with particular settings enabled and filtering applied
[13493] Fixed a bug where labels were rendered outside the shaded background of the column containing them
Fixed a glitch related to image/BB widget placement in table components
[13476] Split OperationPickN into two different operations which pick data along different dimensions.
OperationPickN -> OperationPickInnerN (the original) AND OperationPickOuterN
“Inner” means dimension 0, while “Outer” means “the outermost unrolled dimension”. For 1D arrays this will both be 0, while for 2D arrays the outermost dimension will be 1.
For visualization, OperationPickInnerN (the original OperationPickN) is used (as before) to extract e.g. X/Y/Z coordinates
However, when selecting Derive | Pick[..] in the context menus, the created virtual column will be OperationPickOuterN. This is the intuitive behavior, which will e.g. pick a single 3-component embedding from a list of 3-component embeddings.
Similarly, OperationPickRandom is now implemented in terms of OperationPickOuterN
OperationCount now supports N-dimensional properties and reports outermost element size
[13516] Made it so that the same color is not picked for different foreign tables
[13574] Optimized the creation of menu items for operations
[13566] Made it possible to also show the value map dialog for predicted BBs that cannot be edited
[13586] Made it so that editing the mask for a sample toggles the Edited column value for that sample
[13587] Made it so that 4 will now toggle mask images (while 5 still toggles ordinary RGB images). This collided with the previous mapping to “Tweak selected Runs/Tables”, which has now been moved to P instead.
[13611] Improved visibility of selected-filter-property icons (especially when checked)
[13647] Fixed a bug where column sorting would not work if the column name contained ‘-’
[13643] Fixed an issue with OperationCommon when applied to empty cells, which would previously result in a value of 0, but now results in “(No values)”, which is consistent with the existing “(Multiple values)”
[13562] Fixed a bug where the crosshair would not show axis labels when hovering over confusion matrix boxes
[13661] Fixed an issue where text was difficult to see in highlighted filters when using dark mode
[13664] Fixed a glitch where numerical input fields were too wide in the filters panel
[13608] Fixed a bug when setting a chart as a favorite
[12962] Made it so the number of workflows available is shown on the workflow icon
[13677] Made it so OperationTraversalIndex an operate on multiple columns as long as the total component count is 1, 2, or 3
[13678] Introduced a new OperationZip operation that zips together multiple columns into a single column
[13683] Made it so OperationLength can work on multi-column inputs
[13563] When a Workflow refers to a widget, make sure the widget is scrolled into view (if necessary)
[13695] Tweaked the visibility eye icon
[13696] When selecting a column, force the corresponding filter widget into view
[13153] Added arrows from the workflow dialog to the components it references
2.5.6
Features
[10437] Added support for overlaying properties on top of charts in Tweak layer
Allow for display and in-place editing of single properties (of the selected table row) in the Tweak layer
Allow for dragging properties (typically from column headers) onto the Tweak layer in 2D/3D charts. Possible drag targets are shown as yellow, similar to the drag targets in the Chart title.
Show/hide Tweak properties in the Chart configuration dialog (invoked from the charts toolbar). This is the dialog that already controls other property bindings for the active chart (e.g. X, Y, Z, color, etc.)
[13218] Added support for painting onto writable bitmaps, including mask bitmaps used for image segmentation workflows
Added support for painting into single-channel segmentation images using the existing region tools (rectangle, lasso, etc.)
By default enabled two pre-existing paint tools (which could previously be enabled from the Settings menu):
The Polygon tool - useful to select/paint elements with straight edges (e.g. a door)
The Brush tool - useful to refine edges/outlines of curved shapes
The paint-bitmap user interface looks and works in ways similar to when drawing bounding boxes, including K and L to select the previous/next label to paint, and J to pick the label under the mouse pointer and set it as the active paint value
Painting, like other editing operations, supports undo/redo
Defaulted images to be shown using Nearest neighbor interpolation, and restored display of lines, which helps guide painting
[10898] Linked together the filters shown in the Filters panel with the columns shown in the Rows panel
Order of properties in the Filters panel now matches the order of columns in the Rows panel
Visibility eye icon for a filter in the Filters panel controls whether the corresponding column is shown in the Rows panel
When properties are children of a particular property (i.e. virtual), join the colorized backgrounds into one (rather than previously make colorization per column)
When filtering on a column, show the same background indication color in the Rows panel as in the Filter panel
[13426] Made it possible to drag a column to onto a charts tab to create a new chart for that column on that tab
[13260] Made it possible to select bounding boxes using the paint tools
[11749] Made it possible, when filtering enum properties, to require ALL checked items to be present (as opposed to the default of ANY). This is controlled by clicking on the
&icon for the filter, which is deselected by default.[12459] Made it possible for string filters to require that ANY string is present (as opposed to the default of ALL). This is controlled by clicking on the
&icon for the filter, which is selected by default.[10437] Added support for display of multiline strings (optionally with token attributes) controlled using the context menu (similar to image or BB displays)
Enhancements and Fixes
Fixed some bugs related to is-column-selected displays
[13221] Fixed regression where label selection dropdown boxes didn’t respect filter string
[13364] Disallow deleting values in value maps that do not have a histogram (typically mask images) since that means it is not possible to know if the value is in use
[13364] Fixed an issue preventing the possibility of adding a class to a segmentation mask
[13352] Fixed a bug where an image’s zoom would change while navigating between them even if they were the same size
[13356] Fixed an issue where chart titles were incorrect after dragging a column onto the chart
[13412] Fixed an issue preventing mask thumbnails from being displayed in some cases
[13424] Fixed an issue where the visibility eye icon for an overlaid property in a chart would change incorrectly state while navigating through samples
[11050] Made it so the primary element operation works with multi-component numeric inputs
[13383] Made it so the primary element operation works with string inputs
[13384] Added metrics table row column that is hidden by default but may be shown for joined tables to indicate which row in the input table it comes from
[12683] Made it so reducing on one string column also reduces other string columns
[13145] Added an arrow to the component showing the current project to make it clearer that clicking on it will show the project list and allow for selecting a different project
[13468] Fixed bug when grouping or sorting on composite properties
2.5.5
Enhancements and Fixes
[13194] Fixed a bug where trying to select all bounding boxes in a chart through the context menu or by the keyboard shortcut
Ctrl+Awould only select one bounding box instead of all of them[13208] Fixed a regression where accepting predicted bounding boxes would incorrectly assign some predicted labels as ground truth labels and cause the new table to be unreadable
[13001] Added a cache control header for demo Dashboard datasets to minimize the time it takes for new datasets to show up for users that have previously visited the demo Dashboard
[13225] Added documentation links to some workflow steps to get help on how to do specific tasks
[13219] Avoid encountering an assertion error when starting the Dashboard in some cases
2.5.4
Features
[11524] Added confusion matrix workflow
Enhancements and Fixes
[13046] More improvements to the user experience for workflows in general and for the product tour in particular
[13079, 13080, 13083] Added some checks to avoid null dereference in several cases
[13066] Fixed issue that could lead to a runtime error when switching runs if “occurrence” is derived
[12994] Made it so that new tabs cannot be created for the Charts panel for the Runs view since all of the relevant charts are shown automatically.
[12995] Fixed an issue that would sometimes lead to Charts panel tabs getting the same name
[13082] Fixed a bug that could lead to an error when using the “count” operation
[13081] Added checks to avoid errors when loading images, such as when images are too large or have malformed sizes while loading images
[12651] Removed some unused bounding box editing parameters from the settings dialog
[13097] Made it so that bounding box annotations are not hidden by box outlines
[13109] Fixed an issue that could lead to the image in a chart not matching the selected row after filtering
[12954] Fixed an issue that led to next/previous bounding box functionality not being available in some cases
2.5.3
Features
[12921] Made it possible to do an enterprise local, customer managed install of the Dashboard using the
3lc-dashboardPython package.
Enhancements and Fixes
[12320] Improved the user experience for workflows in general
[12320] Cleaned up and streamlined the steps for the product tour
[13043] Fixed issue where sum and multiply operations were considered order-dependent
[13041] Fixed issue where scroll bar was invisible for some components when using dark mode
[13038] Updated GPU detection so more recent models are treated correctly as max-tier
2.5.2
Features
[8743] Added new bounding box paint functionality using the new pencil icon or the keyboard shortcut
U[12737] Made it possible to create an NMS (non-maximum suppression) virtual column in order to eliminate overlapping bounding boxes
[8743] Made it possible to navigate between bounding boxes in a chart with the new next and previous selection options
[10022] Created new “Accept predicted bounding boxes dialog” to allow for precisely selecting predicted bounding boxes to turn into ground truth bounding boxes for use in later training
[10911] Made it possible to do most bounding box editing operations with keyboard shortcuts
CTRL+SHIFT+L: Snap to next/previous bounding boxCTRL+SHIFT+K: Snap to double-clicked bounding boxU: Paint new bounding box (then left drag to create)M: Immediately accept selected predictionsCTRL+M: Accept selected predictionsI: Immediately accept predictions for this rowCTRL+I: Accept predictions for this row
[11204] Made it possible to delete tables rows altogether to e.g. remove samples from later training
[12734] Add shortcuts for Mac users based on the
Commandkey rather thanCtrl[11716] Made it possible to create additional tabs for charts in the Charts panel and to close tabs
Enhancements and Fixes
[12747] Disallow creating a reduced Table when input table hasn’t been loaded yet
[12710] Avoid assert triggered in some cases when loading the Dashboard
[12853] Log when renaming a Run succeeds or fails
[12777] Fixed a bug when combining filters and lasso selection that could cause additional samples to be shown in the Rows panel
[12889] Fixed a runtime error that could occur when loading bounding box embeddings
[5570] Made several tweaks to improve user experience when dragging onto Charts background
2.5.1
Features
[11036] New Demo Dashboard: Experience the 3LC Dashboard with our newly launched stand-alone demo version, available at https://demo-dashboard.3lc.ai. With the demo Dashboard, you can experience the insights provided by 3LC using example datasets, all without requiring any additional installation.
[12649] Render performance settings tailored to your hardware: 3LC now enhances your experience by automatically detecting your GPU profile and adjusting rendering performance settings for optimal 2D/3D chart visualization. The settings dynamically adapt to the type of GPU your browser uses and adjust in real-time, even when your laptop switches to battery power. You can also manually adjust these settings to suit your preferences.
[12395] Added a step to the product tour that checks for GPU compatibility and provides guidance for making sure the Dashboard is using the expected GPU. This compatibility check can also be accessed in the about box.
[12552] Added render setting to “Show projection shadows on 3D charts”
[12644] Exposed render settings to enable/disable edge shading and SSAO
[12527] New Value Map Creation: You can now create value maps on scalar numeric columns that do not have them.
[12566] Added keyboard shortcuts for toggling most boolean values in the Settings dialog
Enhancements and Fixes
[12581] Made it so browser does not cache Dashboard pages in a way that prevents automatically using the latest version when it is released
[12604] Log when detecting WebGL performance issue such as the use of software rendering
[12060] Grouped Runs charts into tabs with six charts each to avoid exhausting WebGL contexts
[12456] Changed the way colors are selected for Runs
[12597] Fixed a bug where switching between light and dark mode would not update the background of existing charts
[12606] Include ‘description’ in Runs hyperparameters dialog
[12561] Made it possible to show/hide Run columns from within the Runs hyper-parameters dialog
[12628] Made it possible to create certain virtual columns (e.g. “TP->Sum”) with a single click
[12633] Fixed alignment of about box text
[12634] Fixed an issue where the bounding box settings on different charts were not independent
[12635] Fixed an issue where image settings would sometimes automatically reset after being idle
[10987] Fixed a bug where disabled menu items still appeared to be clickable
[12667] Fixed a crash when trying to subtract two different 3D embeddings columns
[12678] Limited number of undo/redo snapshots to 100 to avoid memory and performance issues
[12659] Fixed an issue where you could not reduce by image URL string columns and fixed display names of reduced table
[12679] Made a few optimizations to improve performance with undo/redo snapshots
[12689] Fixed a bug that caused the index virtual column not to work
[12689] Fixed an issue where filters would not be updated when adding a value map or adding new value map values
2.5.0
Features
[12427] Updated processes to support proper incremental semantic versioning for the 3LC Dashboard
[12289] Treat elements that are filtered out from the Filters panel differently from elements filtered out by paint commands by default.
The “Show filtered out points” and “Show filtered out lines” settings are by default On, but they do not show elements which are filtered out from the Filters panel.
Added an option to effectively treat a Filters panel criteria like a paint command (i.e. show it as a disabled background element).
[12372] Made it possible to override the default file name and provide a description when committing edits
[12391] Show mask images with color substitution and alpha in tooltip thumbnails and table grid view
[11426] Introduced new “Weight confused samples workflow”
Enhancements and Fixes
[12060] Made several fixes to address and/or log potential problems when showing many charts, which can e.g. use up all available WebGL contexts
[10876] Fixed a bug where no tooltip showed when hovering over a disconnected point in a Runs chart
[12233, 12265] Fixed sorting and show lineage in Run details panel
[11930] Fixed some issues with date formatting
[10901] Provide feedback when Runs are empty or cannot be opened due to missing or incomplete metrics collection
[12298] Fixed a bug where double-click on buttons could bubble up to parent
[12343] Fixed a bug where sample-based filters would not have an effect if bounding-box based filters were applied
[12342] Fixed a bug where the legend would not show all classes when reducing on a label column
[12388] Fixed a bug where changing the value of an editable column row back to its original value would not show the correct value
[12399] Made it possible to select and copy the text in the Run hyperparameters dialog
[12359] Fixed a bug with 2D boxplot rendering having non-uniform sizes
[12398] Fixed a bug where coloring BBs by TP/FP/FN did not work
[12432] Fixed glitches in input text field enforcement of valid characters
[12433] Made it so when text is selected, Ctrl+C is not be captured by the copy-chart-to-clipboard action
[12436] Fixed an issue with snap-to-contents in empty 2D view
[12010] Properly handled cases where vector columns (e.g. embeddings) cannot be meaningfully decomposed
[12497] Make aggregated points default OFF in settings
[12494] Fixed a bug where buttons to commit or discard pending edits were not visible
Known Issues
The order of columns in the Dashboard filter panel does not follow the order in the tables panel, where the columns are more logically ordered. This will be addressed in an upcoming release.
When renaming a Run in the Dashboard, the old name is sometimes still shown alongside the new name in the Table panel for a short time.