Create a Table from 3D points
Create a 3LC Table directly from row data containing 3D point cloud information using the Mammoth dataset for 3D object analysis.
3D point cloud data requires specialized handling for spatial coordinates, normals, and additional geometric properties. Direct row-by-row construction allows precise control over 3D data organization and metadata.
This notebook demonstrates writing a 3LC Table directly by adding rows from a JSON file containing 3D mammoth data. We use a TableWriter to build up the table with 3D coordinates and associated metadata, creating a Parquet-backed table for efficient 3D visualization and analysis workflows.
Project setup
[ ]:
PROJECT_NAME = "3LC Tutorials - Mammoth"
DATASET_NAME = "Mammoth"
TABLE_NAME = "mammoth-10k"
DATA_PATH = "../../data"
INSTALL_DEPENDENCIES = True
[ ]:
if INSTALL_DEPENDENCIES:
    %pip --quiet install 3lc
Download Source Data
We will use the 3D mammoth data as an example. This is a popular toy dataset commonly used in the dimensionality reduction literature.
The original data can be found in the PaCMAP github repository.
[ ]:
import requests

response = requests.get("https://raw.githubusercontent.com/YingfanWang/PaCMAP/master/data/mammoth_3d.json")
input_data = response.json()
Writing the Table
We construct a TableWriter, which will determine the URL and the schema of the table we want to write. In our case, the table will contain a single column of 3-vectors.
[ ]:
import tlc

column_name = "points"

table_writer = tlc.TableWriter(
    dataset_name=DATASET_NAME,
    project_name=PROJECT_NAME,
    table_name=TABLE_NAME,
    description="A table containing 10,000 3D points of a mammoth",
    if_exists="overwrite",
    schema={column_name: tlc.schemas.Float32Schema(shape=(3,), display_name="3D Points")},
)
[ ]:
# Next we add the data to the table row by row.
for point in input_data:
    table_writer.add_row({column_name: point})

# Finally, we flush the table writer to ensure that all data is written to disk.
table = table_writer.finalize()
[ ]:
# Inspect the first row of the table:
table[0]
Next Steps
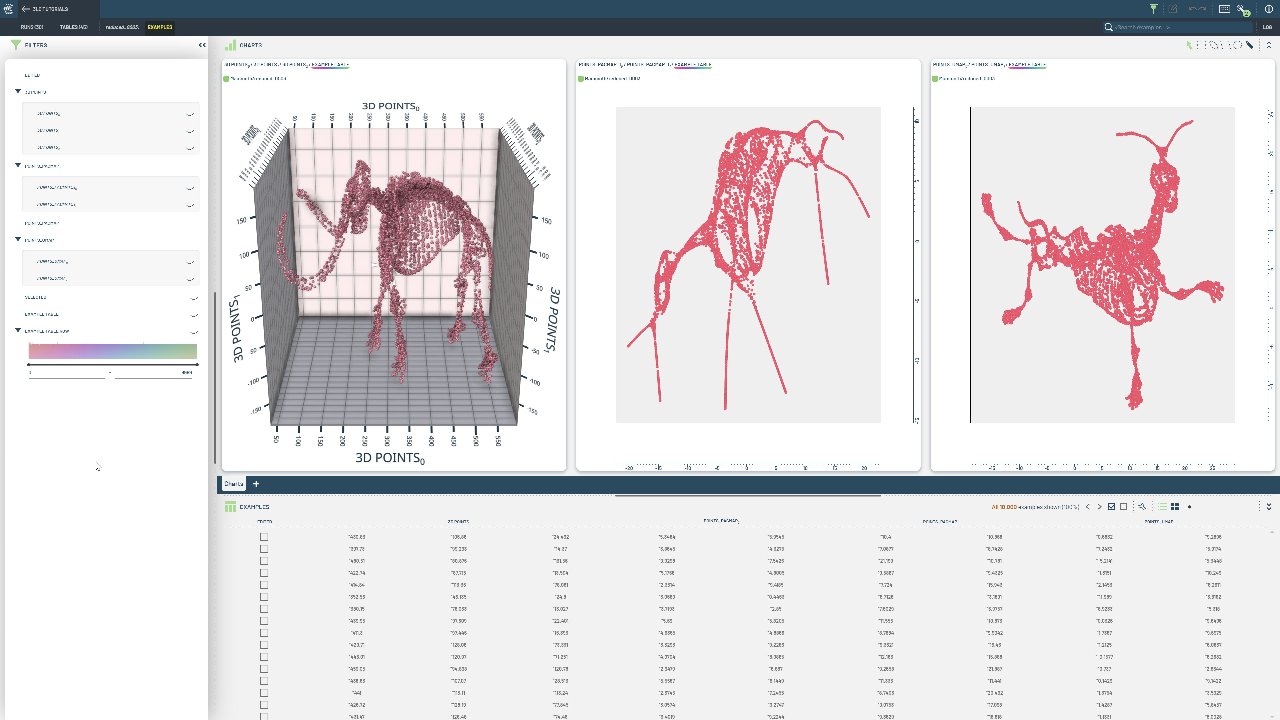
The written table can now be viewed in the 3LC Dashboard.
Some ideas for further exploration:
Visualize the data in a scatter plot
Apply dimensionality reduction to the data
Segment the data into clusters