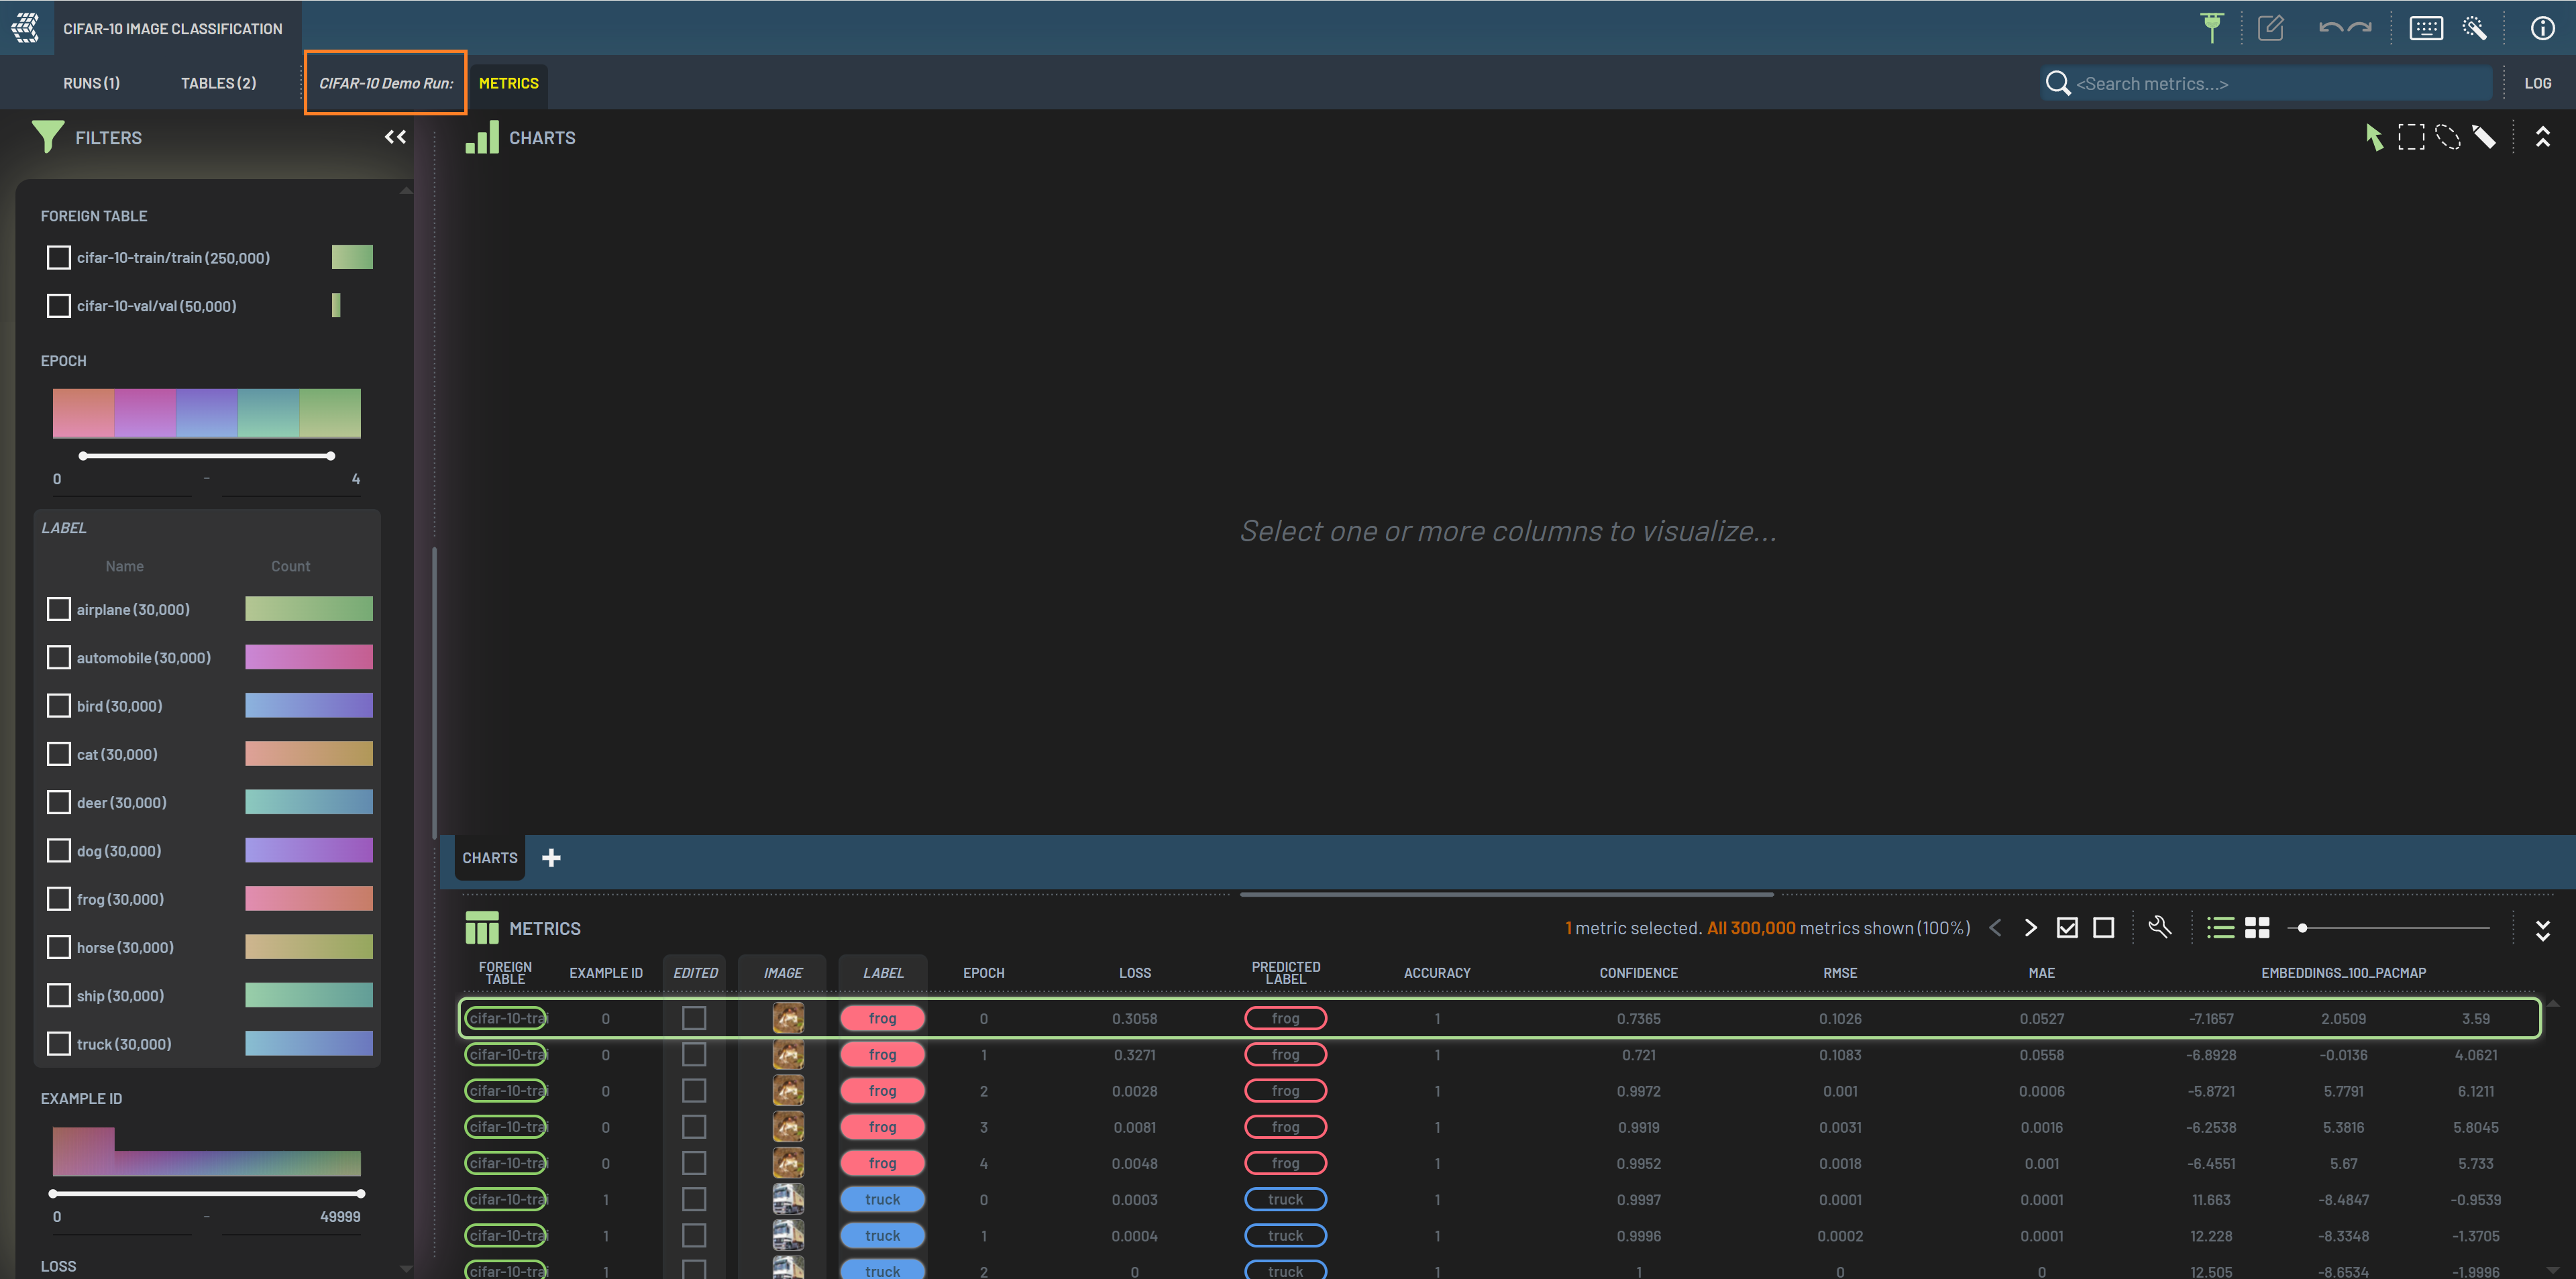
Filters
The Filters panel lets you define which rows you want to show in the Rows panel. Each filterable column in the Rows panel has its own widget in the Filters panel. The type of widget and filtering options depend on the type of the data in the column.
Widgets
Each filter widget has a set of tools on its title bar. The tool icons show up when hovering over or selecting the filter. From left to right, they are:
Show/hide filtered-out points: Show/hide the filtered-out data points in grey in charts; default
hideInvert filter criterion: Invert the applied filter criterion
Reset filter: Reset the filter
Lock: Lock the filter such that
clearing all filterswill not affect this locked filter
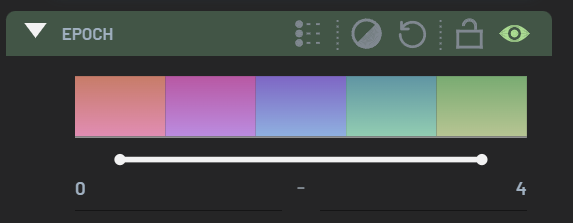
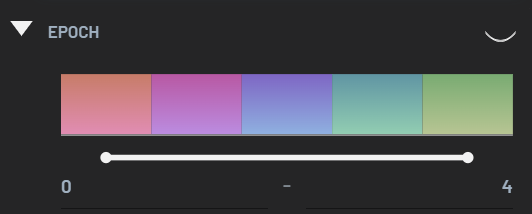
To set the range of a filter, you can do one of the following:
Type in Min/Max values
Drag the end point on the slider
Paint a range on the filter’s histogram by clicking and dragging
When a filter is applied, a green dot appears next to the filter name (also the column header). The applied operations
such as invert will be indicated by permanent appearance of the icon on the filter’s title bar when it’s not on focus.
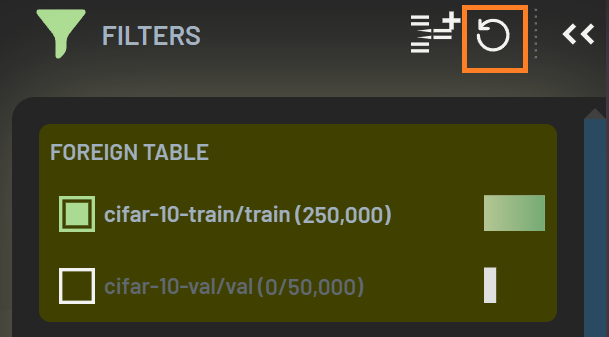
Clearing all filters icon will appear on the title bar of the Filters panel when any filters are
applied. You can click it to clear all applied filters except those that are locked. DoubleClick on
the filter title bar to collapse the filter.
Shortcuts: D and CTRL+G
D: Clear all filters (except those that are locked) and polygon selections
CTRL+G: Clear only polygon selections
Some filter’s histograms are truncated due to space constraints, but the full heights can be shown when hovering over if
Show full-height histogram on hover in the Settings is toggled.
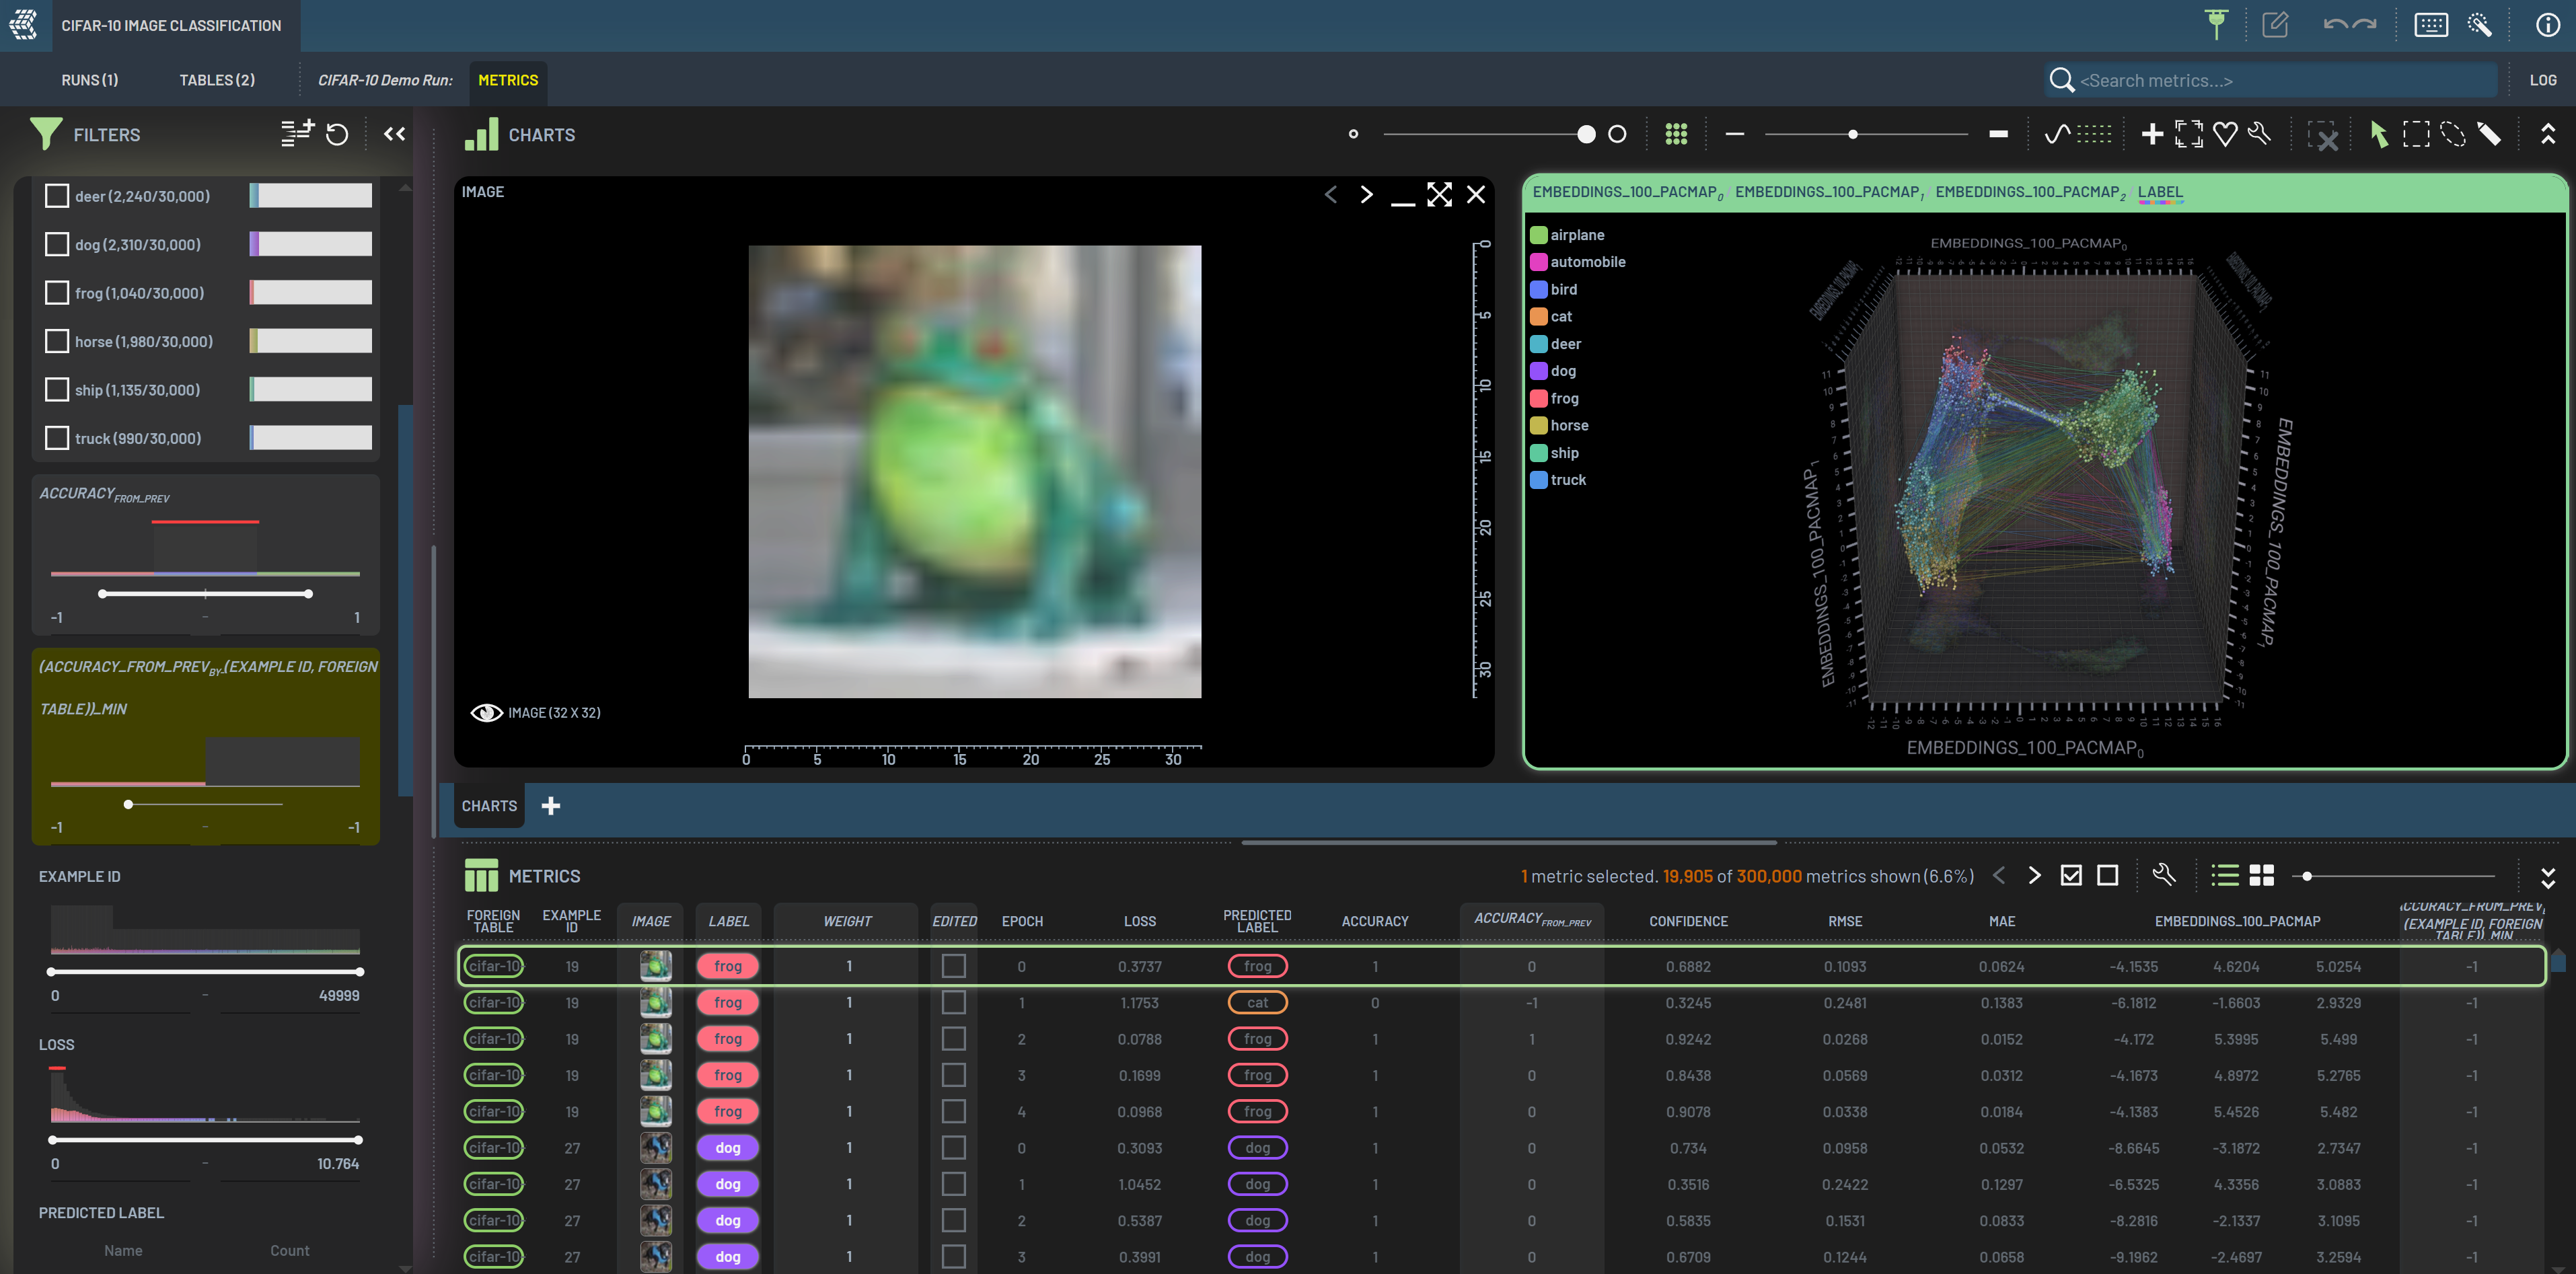
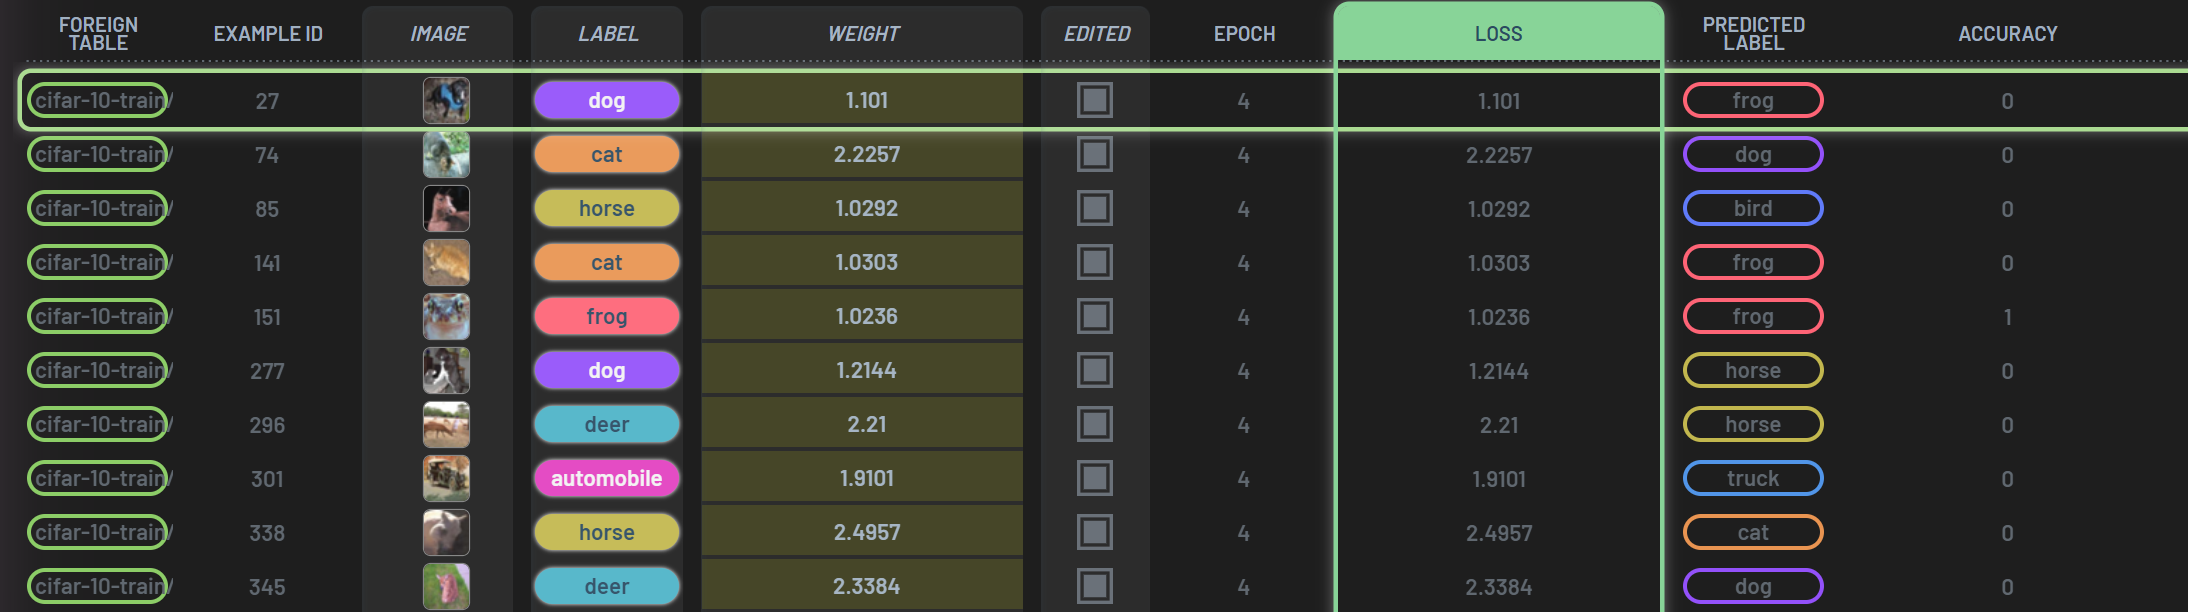
The grey bars in filter histograms indicate the filtered-out samples or elements. The light grey in the background represents those filtered out by other filters (e.g., Foreign table in the screenshot below), while the dark grey in the foreground represents those filtered out by the current filter (e.g., Confidence below).
The Live filter setting (checkbox icon) allows you to turn on and off the live filters. The icon will appear at the
title bar of the Filters panel when some filters are applied. When the Live filter is on (shown as
checked), the applied filters will be dynamically updated whenever any values related to the filters have been changed.
For example, with the unmatched prediction (FP) filter applied, all the unmatched predictions will be filtered in.
When you accept an unmatched predicted bounding box (BB) into a ground truth BB, this predicted BB will no longer be
unmatched and this image along with its BBs will be filtered out. If you want to do further fine tuning on this accepted
BB, you will not be able to as it is filtered out. However, if the Live filter is turned off (shown as unchecked),
this image and the accepted BB will still be present (not be filtered out) despite that this predicted BB no longer
satisfies the filter. This will help you “lock in” the image and the accepted BB so that you can do some fine tuning if
you want. This functionality is very useful when it comes to editing BBs and segmentation masks. When the Live filter
is turned back on again, all filters will be automatically refreshed to its current state.
Filtering in chart
Besides playing with fitlers in the Filters panel, you can also overlay individual filter widgets in a chart. It’s sometimes convenient to have your chart and filters close to each other. To overlay a filter widget in a chart, drag & drop the column header from the metrics table into the designated areas (highlighted by yellow bars at the lower left of the chart area). Applying filters in a chart has the same effect as doing so in the Filters panel. The filter widgets can be collapsed by clicking ▼ or DoubleClicking the title bar.