Views
The Dashboard shows tabular data in the Rows panel at the bottom of the screen. What you see in this panel changes depending on what you are working on or have selected. The Dashboard provides several types of such views:
Navigation: Overview of indexed Projects, Runs, and Tables
Derived views: Views created from other views
Navigation
Navigational views enable you to browse the 3LC objects you create.
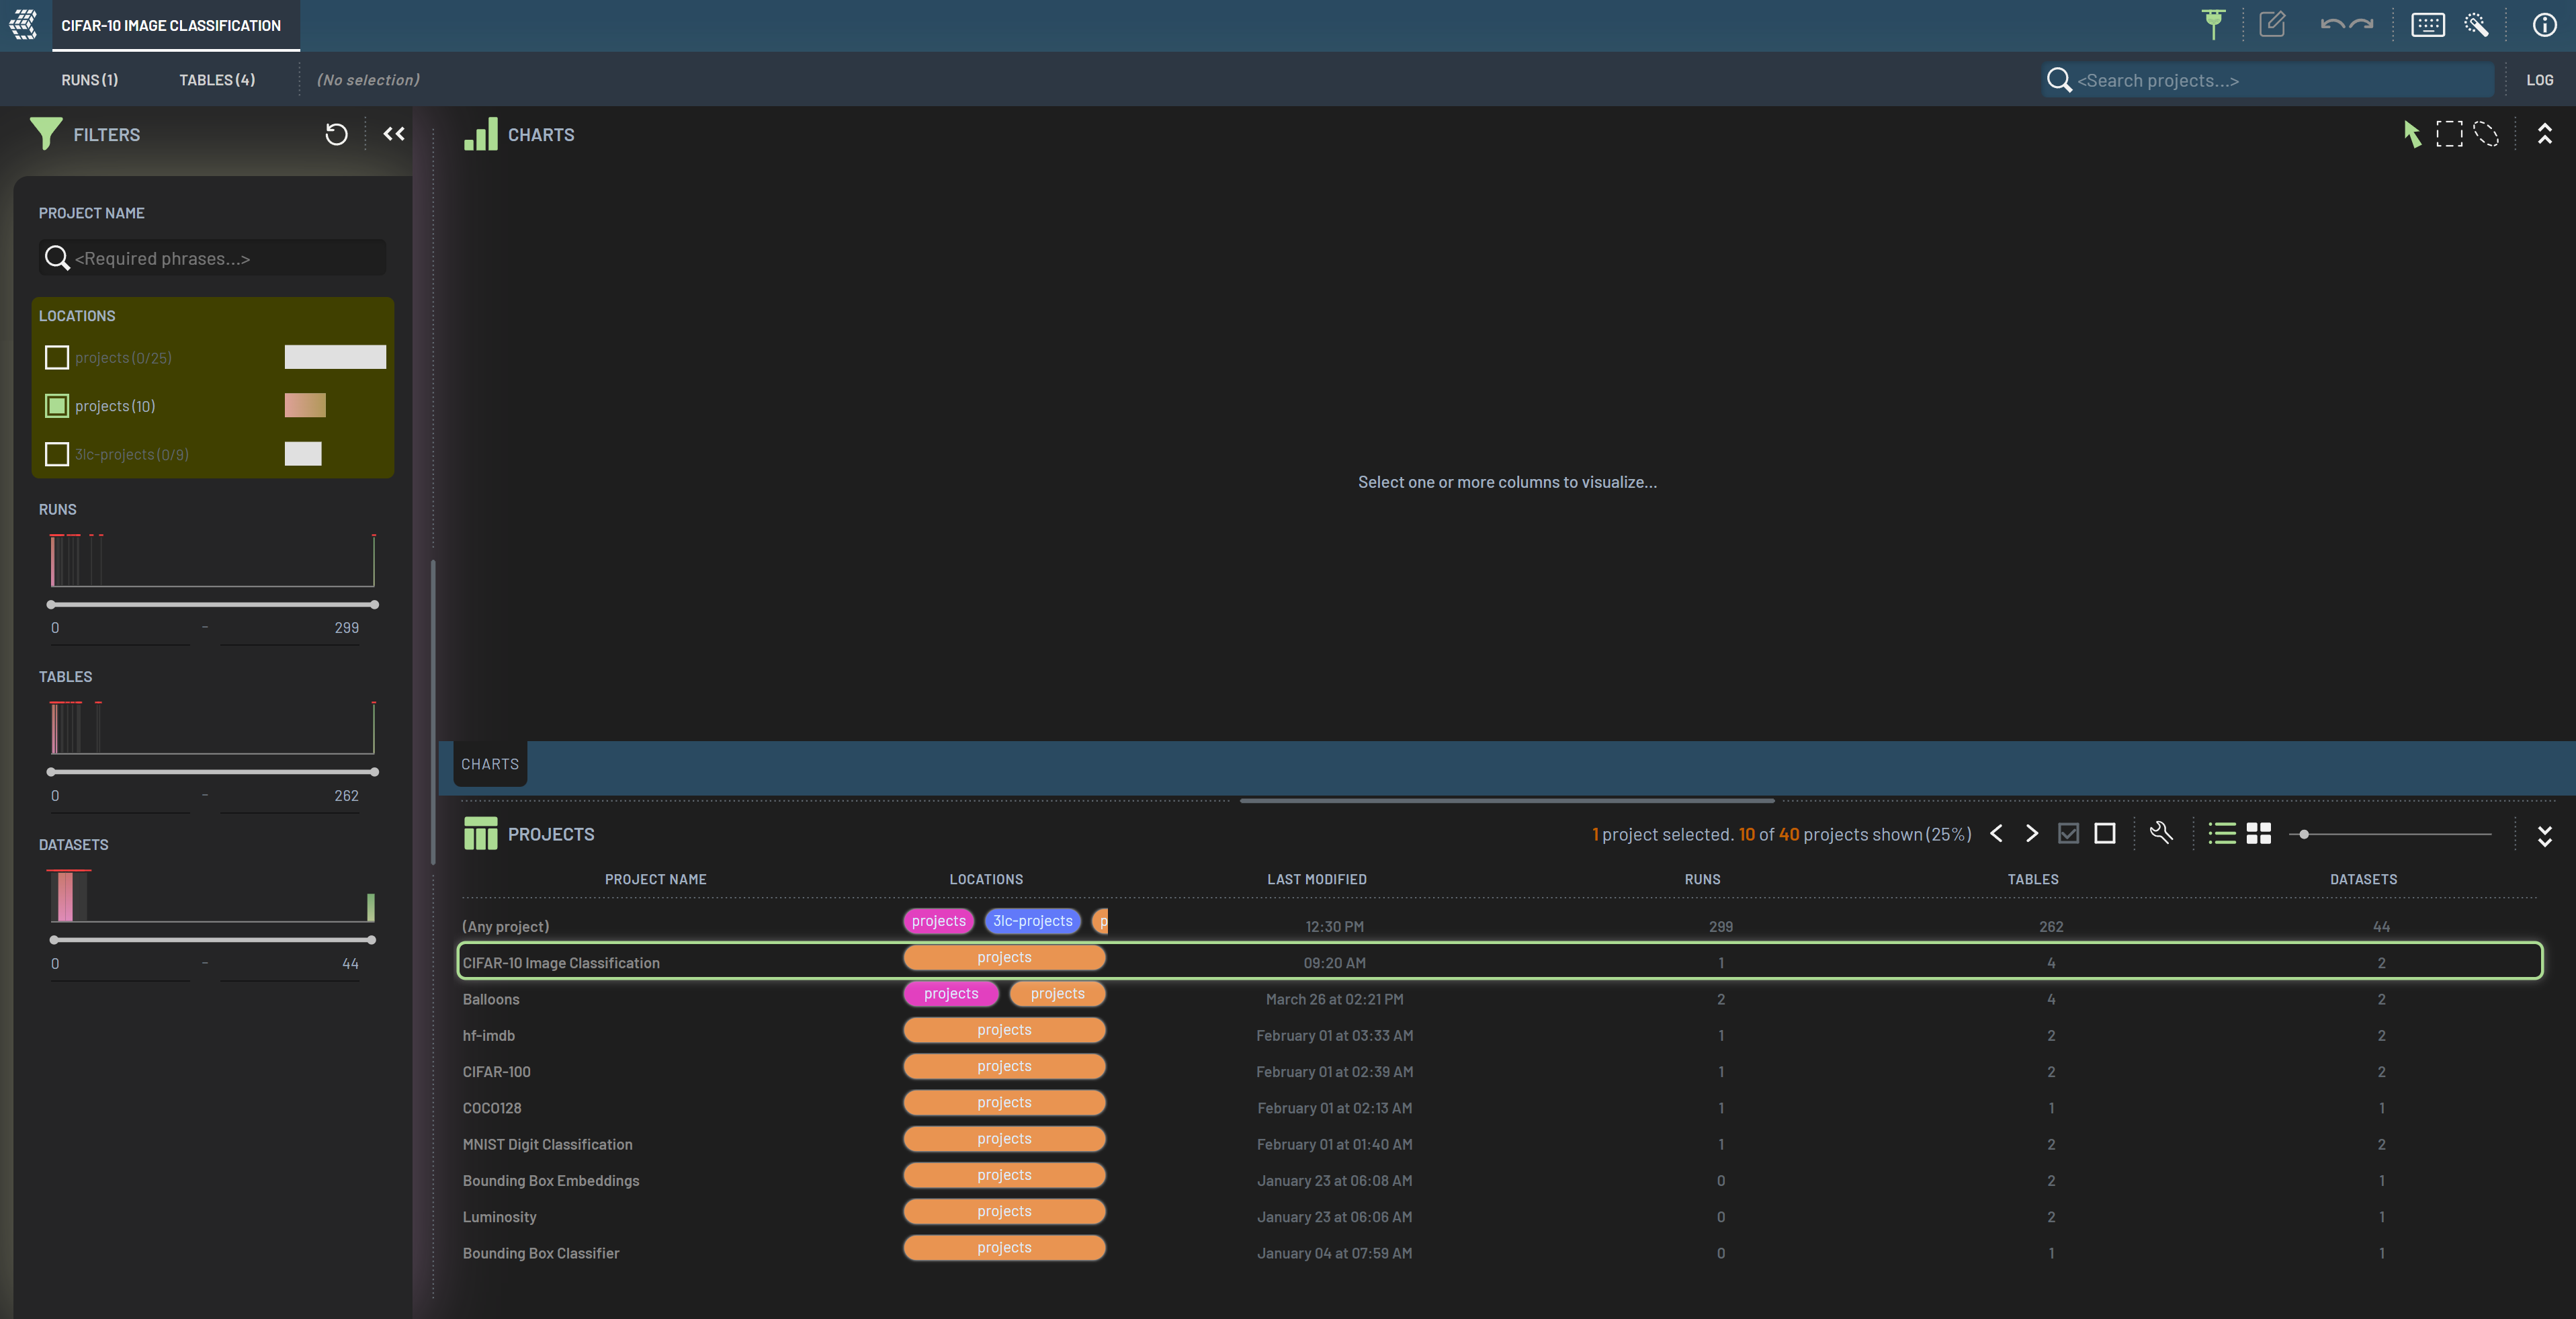
The Dashboard front page shows a list of all available projects in the Rows panel. When selecting a project, the number of Runs and Tables within this project will be indicated by the tabs in the upper left.
DoubleClicking a project takes you to the Runs tab of the selected project. If you instead want to view the Tables of the project, you can click the Tables tab in the top left.
Dashboard remembers your selected project
The Dashboard remembers the last project you had selected and will automatically open that project the next time it is launched. This can be useful as you add Tables or Runs to the project.
(Any project)
The list of projects contains an entry named (Any project), which contains all Tables and Runs across your 3LC
projects. It can be used to search for a specific Table or Run if you don’t remember which project it is in.
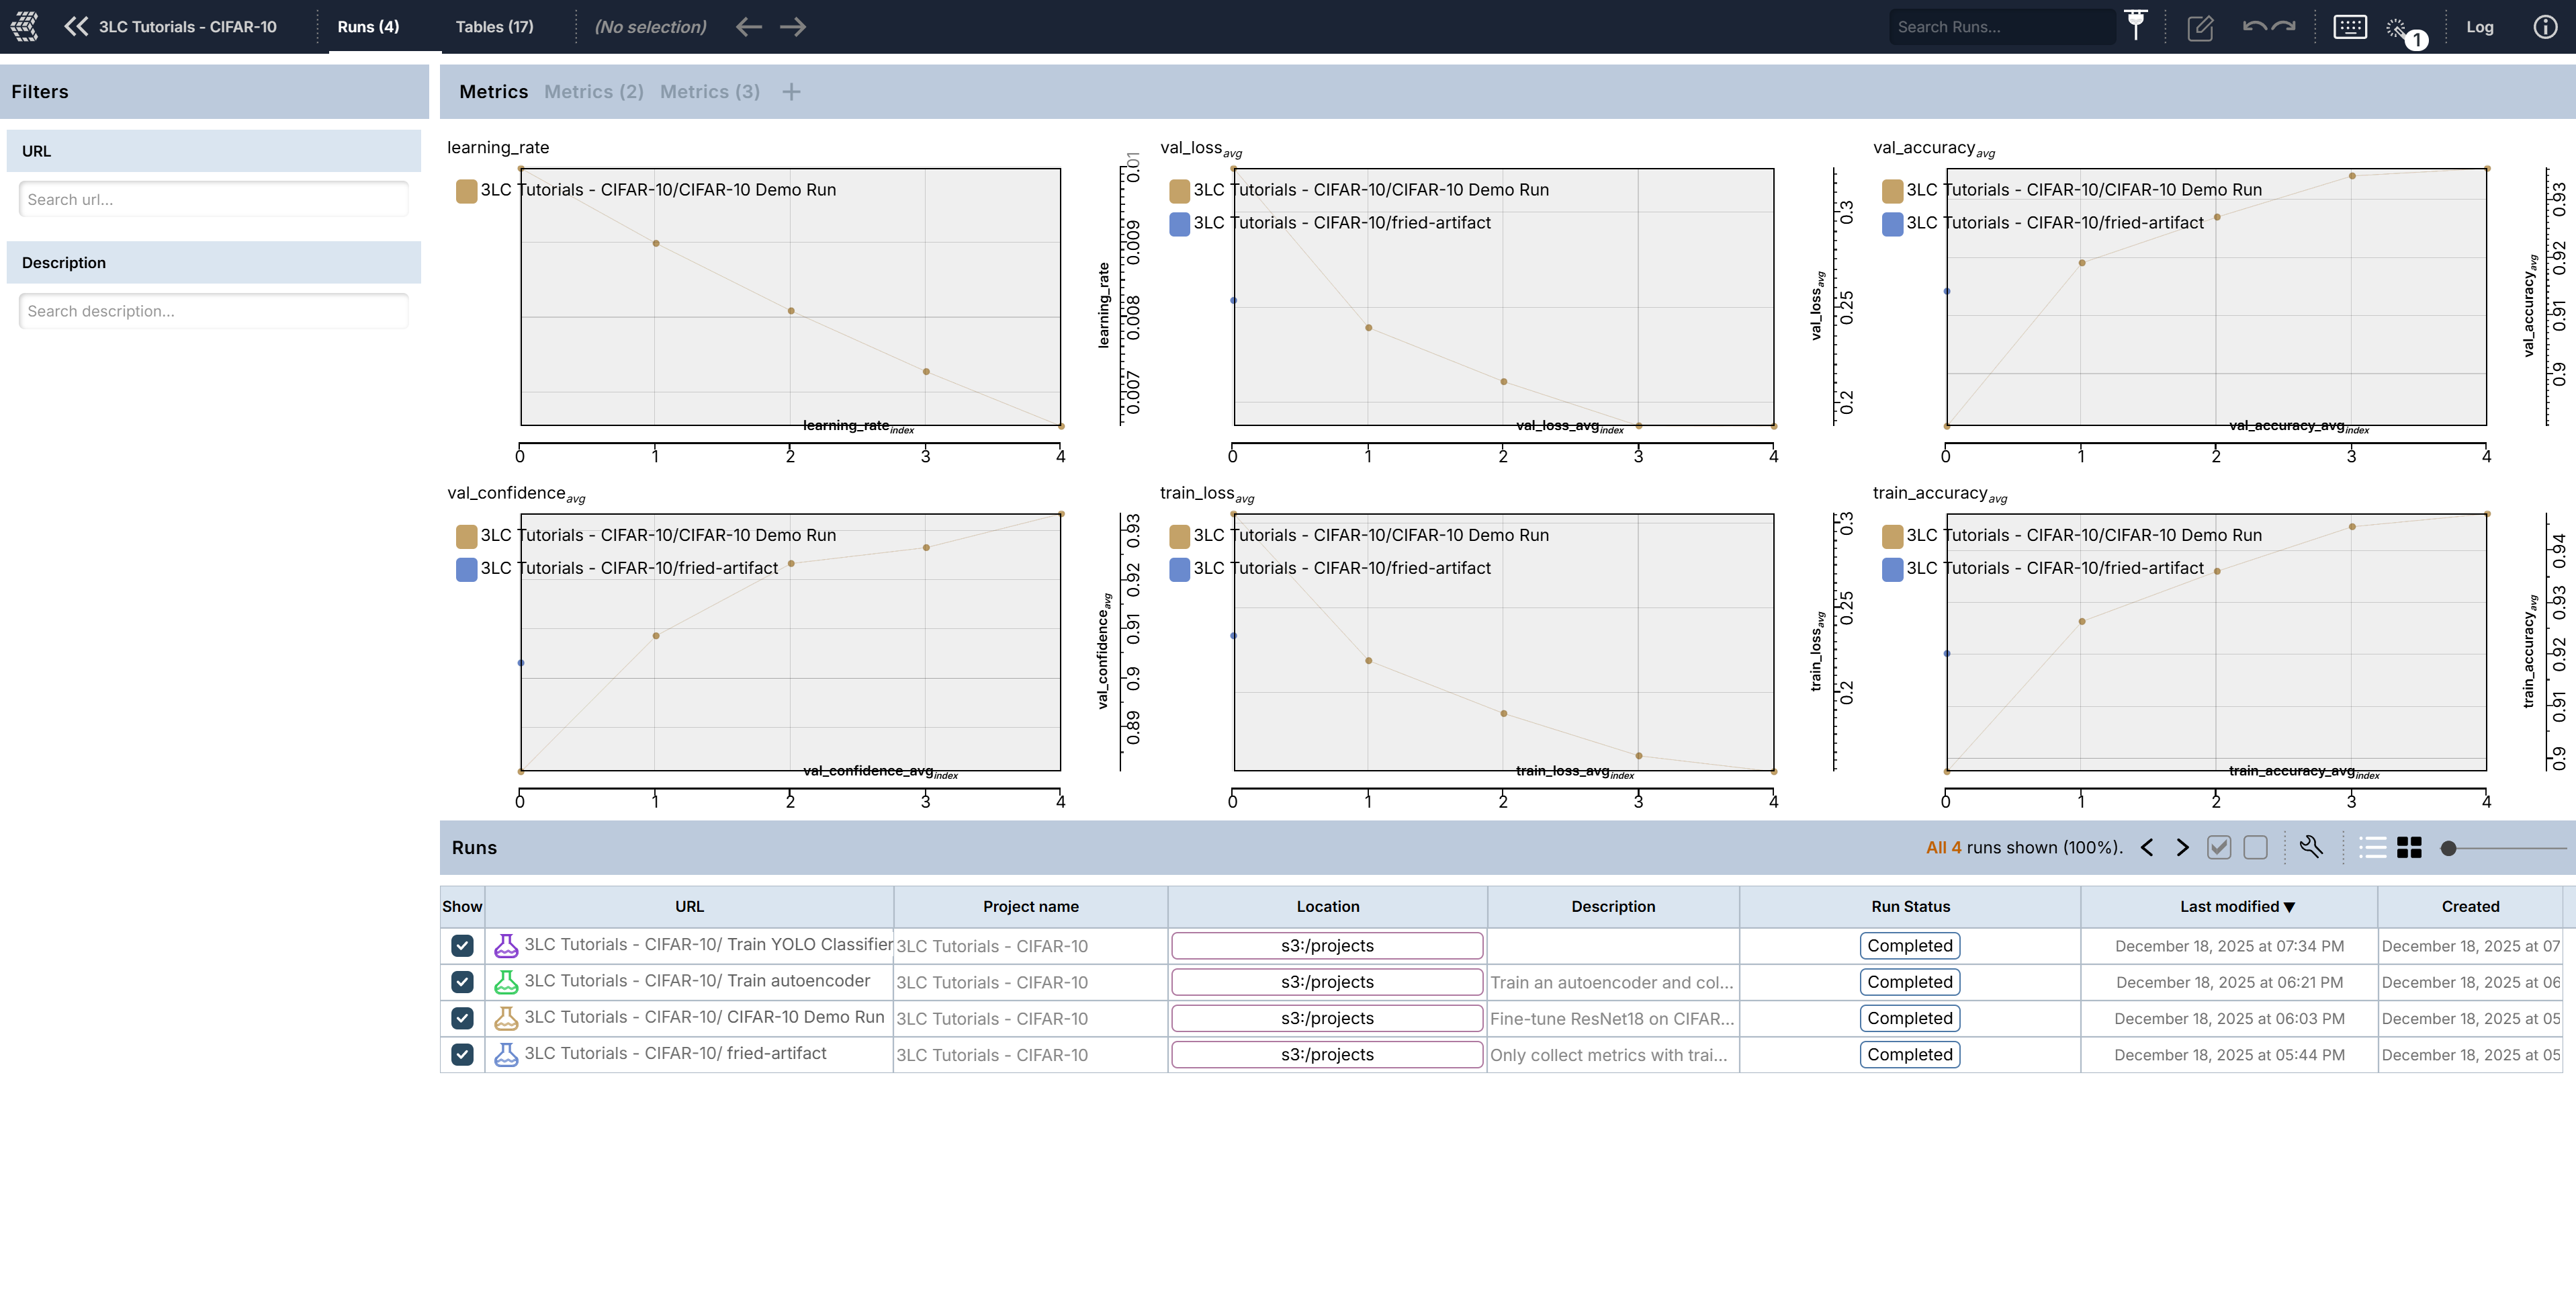
The Runs tab shows all the Runs for the current project in the Rows panel. To give an overview, it also displays a set of charts with aggregate metrics for all the runs in the project in the Charts panel. The following columns are available for Runs:
Show
Project name
Url
Location
Description
Status
Last modified
Whenever you run your Python code with 3LC metrics collection, a new Run will appear as a new row in the Runs panel.
DoubleClicking a row will open the Run, populating the Rows panel with the metrics data from the Run, joined with the corresponding rows of the input Tables.

The Tables tab shows all available Tables for the currently selected project and filter settings. Each row in the Rows panel represents a revision of a dataset registered with 3LC, which is an individual Table in 3LC. By default, it shows the following columns:
Dataset
Favorite
Lineage
Project name
Url
Location
Row count
Created
Table Revisions and Lineage
When edits or other operations are applied to a Table, 3LC creates a new revision which is itself a Table. The system keeps track of revisions and shows this connectivity as directed edges in the lineage column of the Table rows view. This makes it easy to navigate even a complex dataset with many revisions and branching lineage.
Tip: To open a specific Table revision in a notebook simply locate the revision in the Tables tab, hover the URL column to enable the copy-action, perform the copy and then do:
import tlc

table = tlc.Table.from_url(...)
To learn more, see Table Revisions in the User Guide.
DoubleClicking a row will open the Table, populating the Rows panel with the row data from the Table.
Data
Data views are created by opening a Run or Table. These views open actual data containers and display the data itself, not just metadata about the objects like in the navigation views.
Run
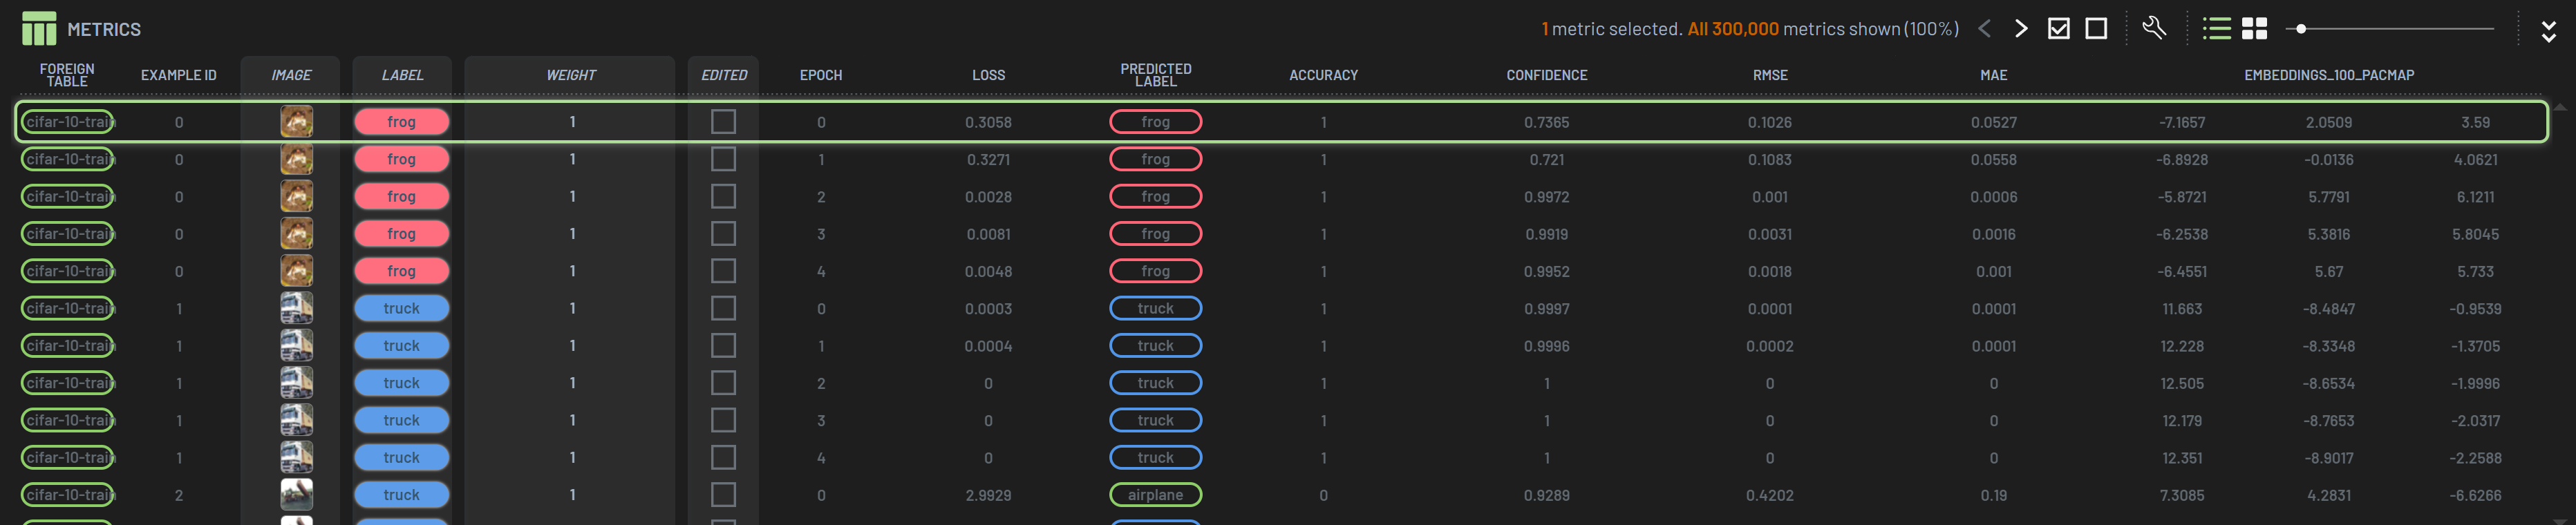
DoubleClick a Run row in the Runs tab will open a dedicated Run view in a tab called “Metrics”. When opening a Run you will see the three panels described in Panels, with a rows panel named Metrics.
When a 3LC Table was used as input to produce the metrics, that input data is joined and shown alongside all the metrics data for the Run. This is at the core of the 3LC workflow, allowing you to make improvements to your data based on the model predictions and metrics.
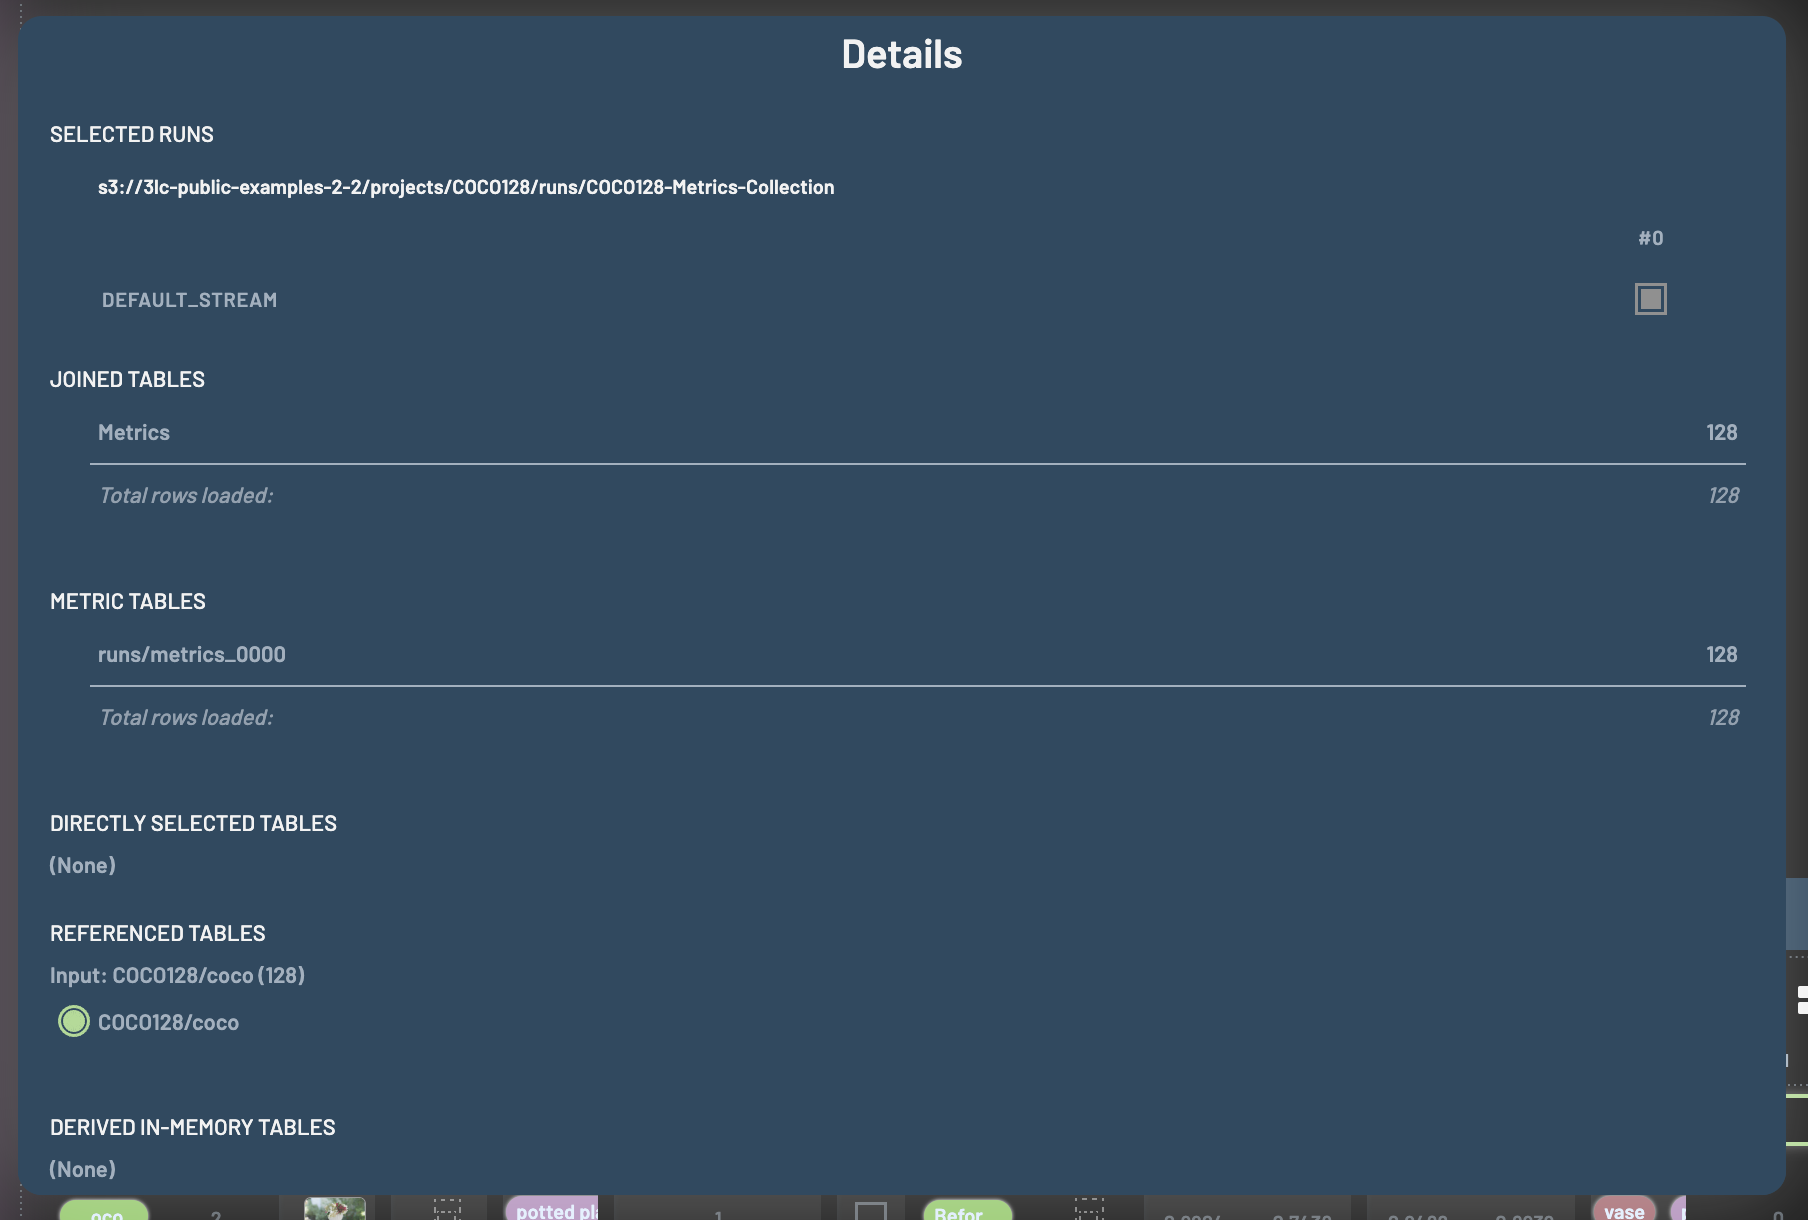
As you begin to edit your data, these revised editions are represented as new Tables. Sometimes, you might want to look at your metrics alongside the latest revision of your data with all the changes you have made, while other times you might want to look at the metrics alongside the data such as it was when the metrics were collected. To control which Table is shown together with the metrics, press P to open the “Details” menu, and scroll down to “Run Input Tables”. Here you can see which Tables are currently being shown, and if multiple Tables exist for the same dataset, you can switch between them.
Just like in a Table, you can modify your samples directly.
Table
DoubleClick a Table row in the Tables tab will open a dedicated Table view in a tab called “Examples”. When opening a Table you will see an instantiation of a particular revision of your dataset. You can modify your samples directly in this view.
Multiple Runs / Tables
If you want to compare the detailed results of multiple Runs or Tables, you can open them in the same session. To do that, click one Run and Ctrl + DoubleClick the other Run in the Runs page. Multiple Tables can be opened the same way.
To compare two Runs in a session, you may want to sort on the Example_id so that samples with the same ID
from different Runs will be next to each other. You can create virtual columns to assist
the comparison. In the figure above, a virtual column, range of predicted BBs counts for each sample, has been added.
This virtual column could be filtered to >1 to see samples that have different numbers of BB predictions for the two
Runs.
Warning
In order to display two Runs in the same session (i.e., all data in the same metrics table under the same METRICS
tab), the two Runs must have exactly the same columns. Otherwise, the two Runs will be opened in two tabs.
You also can compare the recorded hyperparameters when you are in a multi-Run view.
Derived Views
Derived views are created from other data views. They allow you to work with transformed or filtered versions of your data while maintaining the original view.
Subset Table
A Subset table contains filtered-in data at the moment that the subset table is created. When filters and/or polygon selections are applied, you can create a subset table to work with just that portion of your dataset. Subset tables are independent from the original table and other subset tables, meaning any operations in one table will not affect others.
Reduced Table
A Reduced table is derived by computing averages of rows that have the same values on specified reducing column(s). This is useful for aggregating data, such as computing average metrics per epoch or creating confusion-matrix-like visualizations. Reduced tables compute averages for all applicable columns and are static once created.