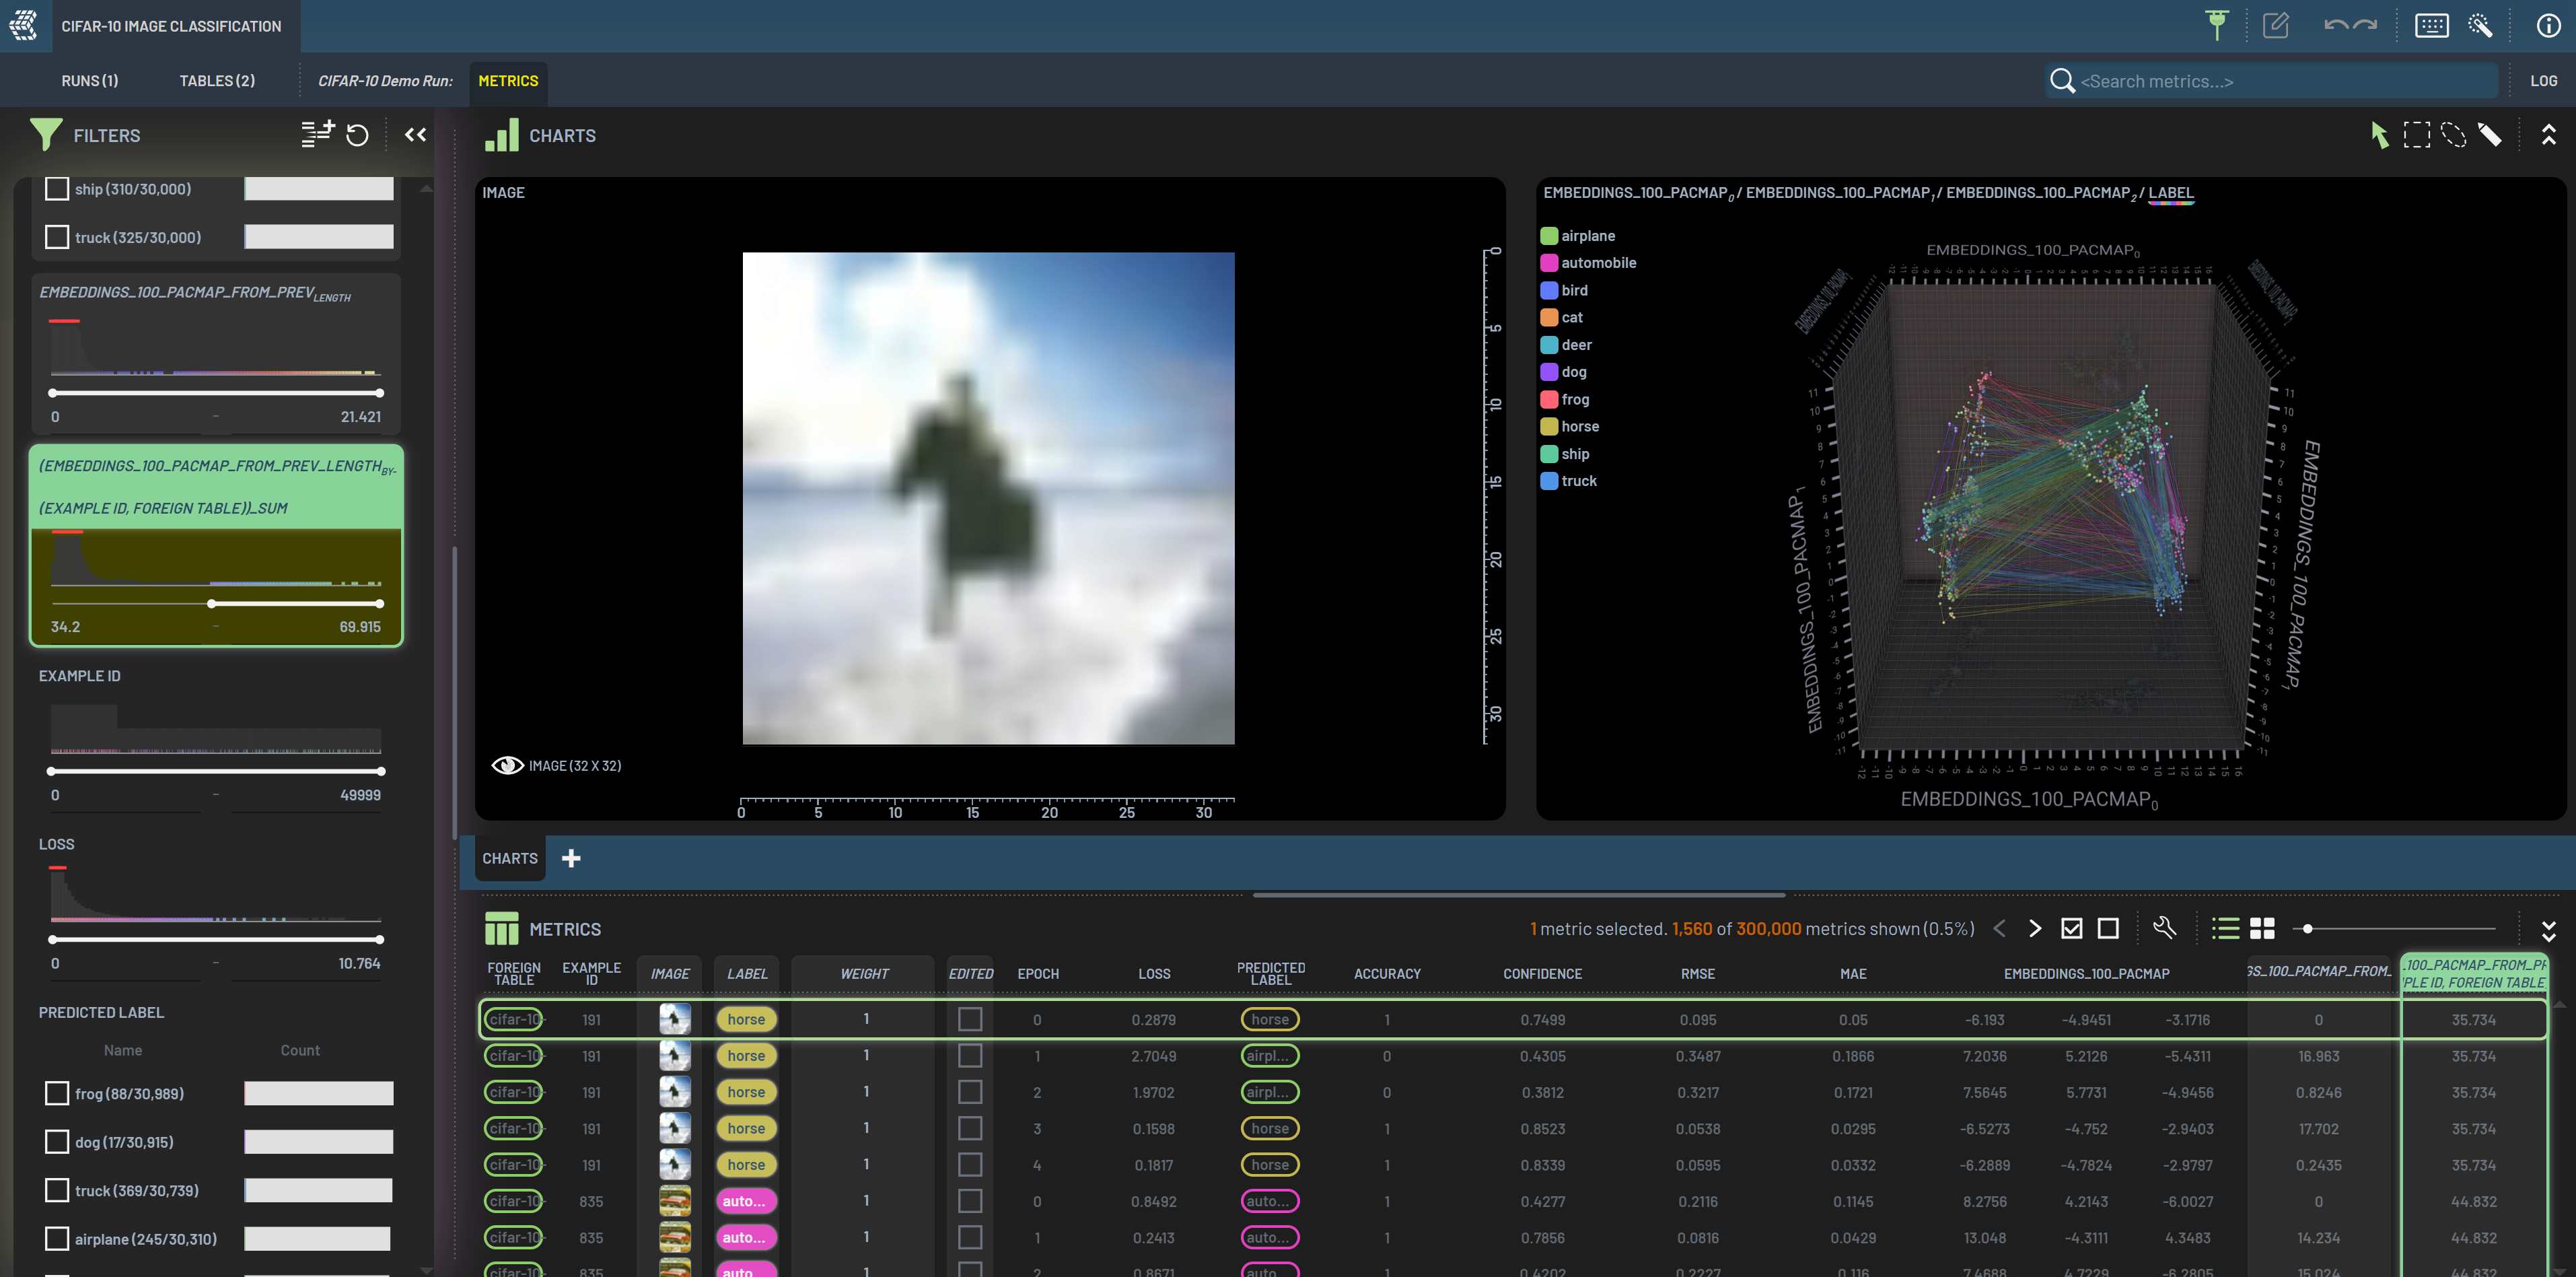
Rows
The Rows panel is a comprehensive view of your tabular data, divided into rows and columns. The exact contents of those rows and columns will depend on the view being displayed. Depending on the context, each row in the Rows panel might represent a revision of a dataset, a Run, a sample in a dataset, or an inference pass over a sample. In the following example, the Rows panel is populated with the metrics of a Run, where each row represents one inference pass over one sample.
Selecting rows
The selected rows are indicated by orange backgrounds. Some selecting operations include:
Click a row to select the row
CTRL + click to select multiple rows
CTRL + click on a selected row to unselect the row
SHIFT + click to select consecutive rows
Press up/down arrow to select previous/next row
Press CTRL + up/down arrow to select previous/next sample (skip the rows of the same sample if multiple epochs recorded)
Click the
Select allicon (square with check mark) or press A to select all rowsClick the
Clear selectionicon (empty square) or press SHIFT + A or press ESC to unselect all rows
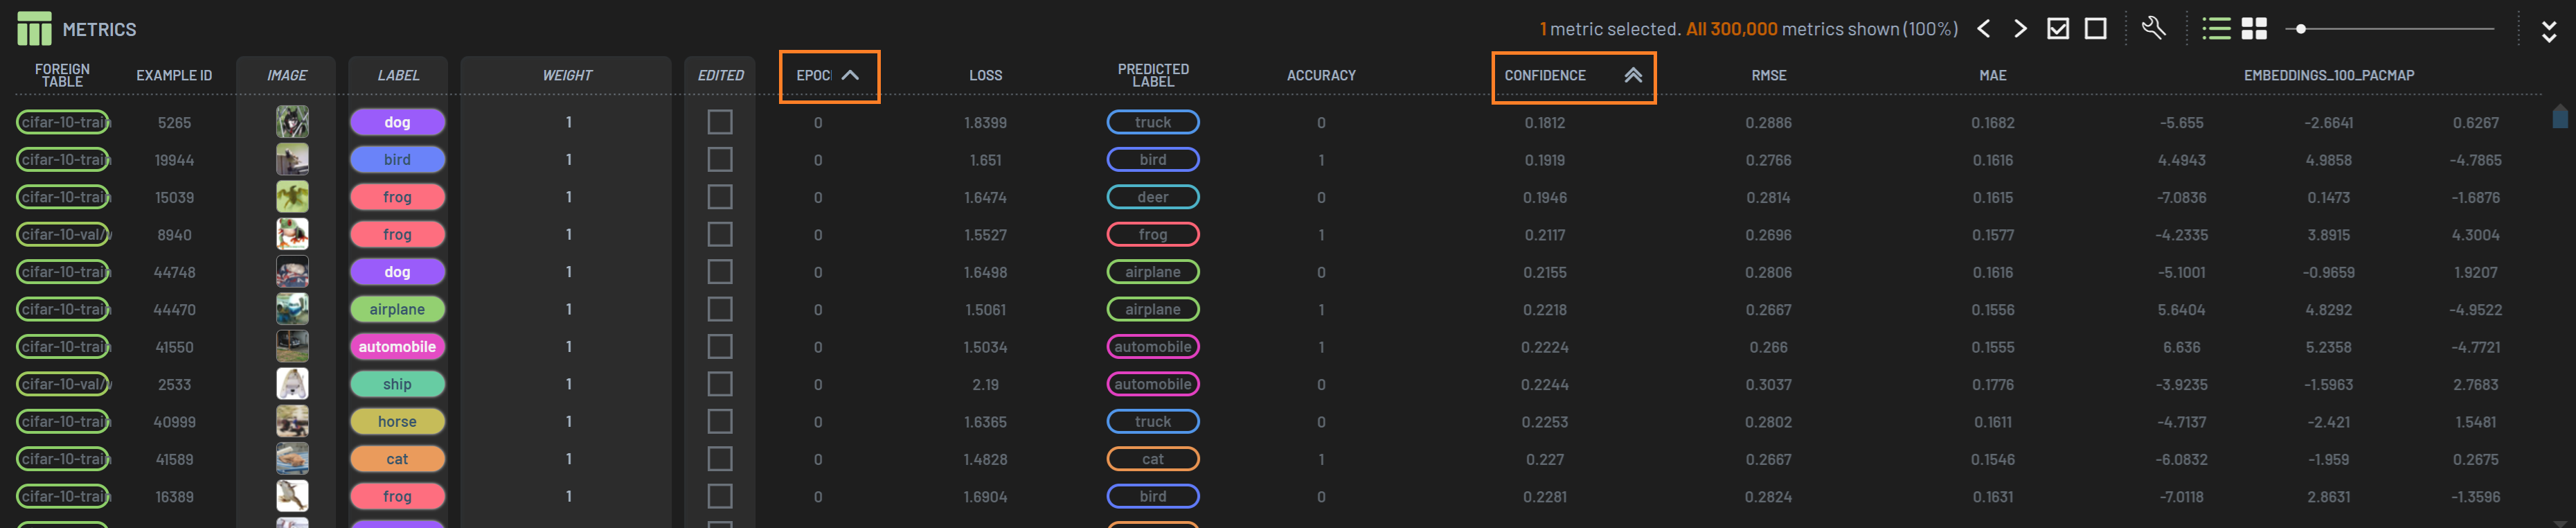
At the top of the Rows panel, you can see how many rows are currently selected at any time, as well as how many rows match the current filter criteria and hence are shown in the table.

Selecting columns
The selected columns are indicated by orange backgrounds. To select a column, click the column’s header. To select multiple columns, hold CTRL while clicking the column headers. Press left/right arrow to select an adjacent column. To unselect a column, click that column while holding CTRL. Column widths can be resized by dragging the boundaries of headers.
ESC: Unselecting in Dashboard
ESC is a universal hotkey to unselect items including rows, columns, and array elements in a cell in the Rows panel, and charts and array elements (e.g., BBs) in a chart in the Charts panel. If multiple items are selected across the charts and the table at a point, pressing ESC unselects the items in this priority: (1) array elements (e.g., BBs in a chart), (2) rows, and (3) columns and charts. SHIFT+A is equivalent to ESC.
Note that you can always unselect a specific item by CTRL + clicking on the item.
Sorting
Most columns in the Metrics/Example panel can be used to sort the rows. To sort by a column, SHIFT+clicking on the column header. SHIFT+clicking cycles through ascending, descending, and no sorting. Ascending sort is indicated by ▲ on the column header, and descending sort is indicated by ▼.
Sorting on multiple columns can be done by CTRL+SHIFT+clicking on a column header. Similarly, CTRL+SHIFT+clicking cycles through ascending, descending, and no sorting. The second sorted column is indicated by 2 next to ▲ or ▼. For multi-sorting, the earlier sorted column has priority.

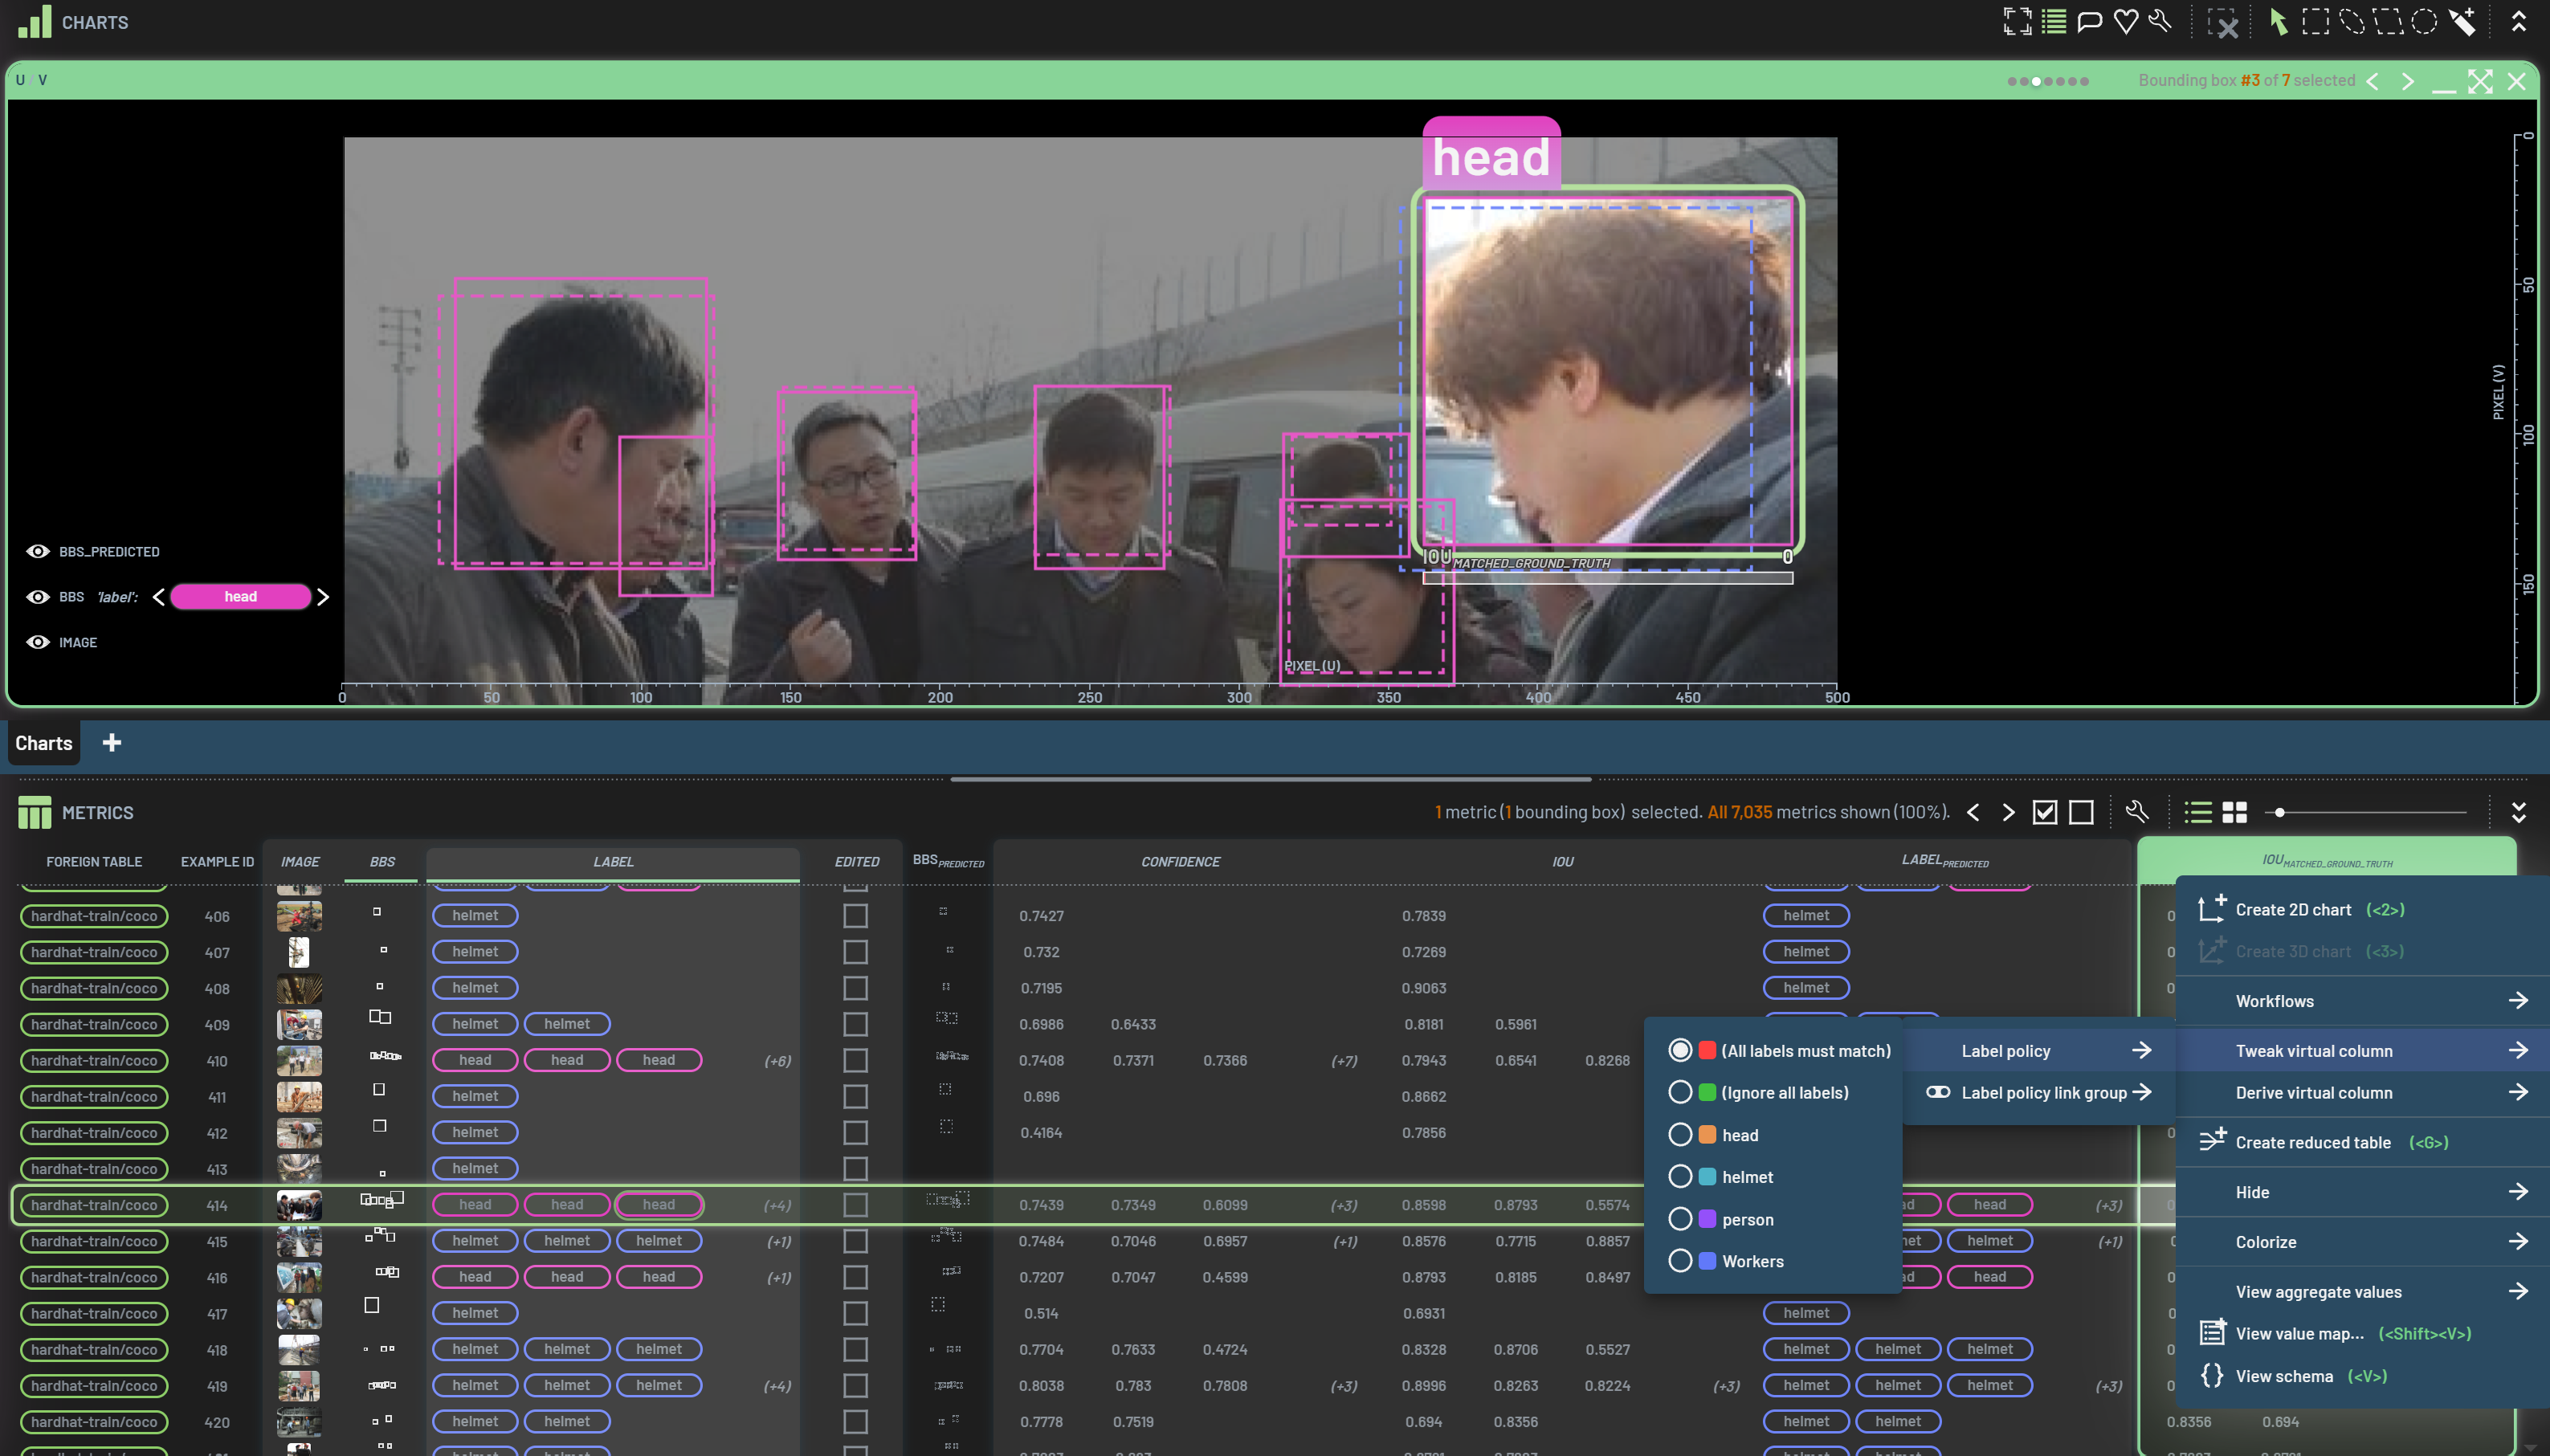
Hiding/showing columns
You may want to hide some columns if the Rows panel gets too crowded. Any column can be hidden or shown. To
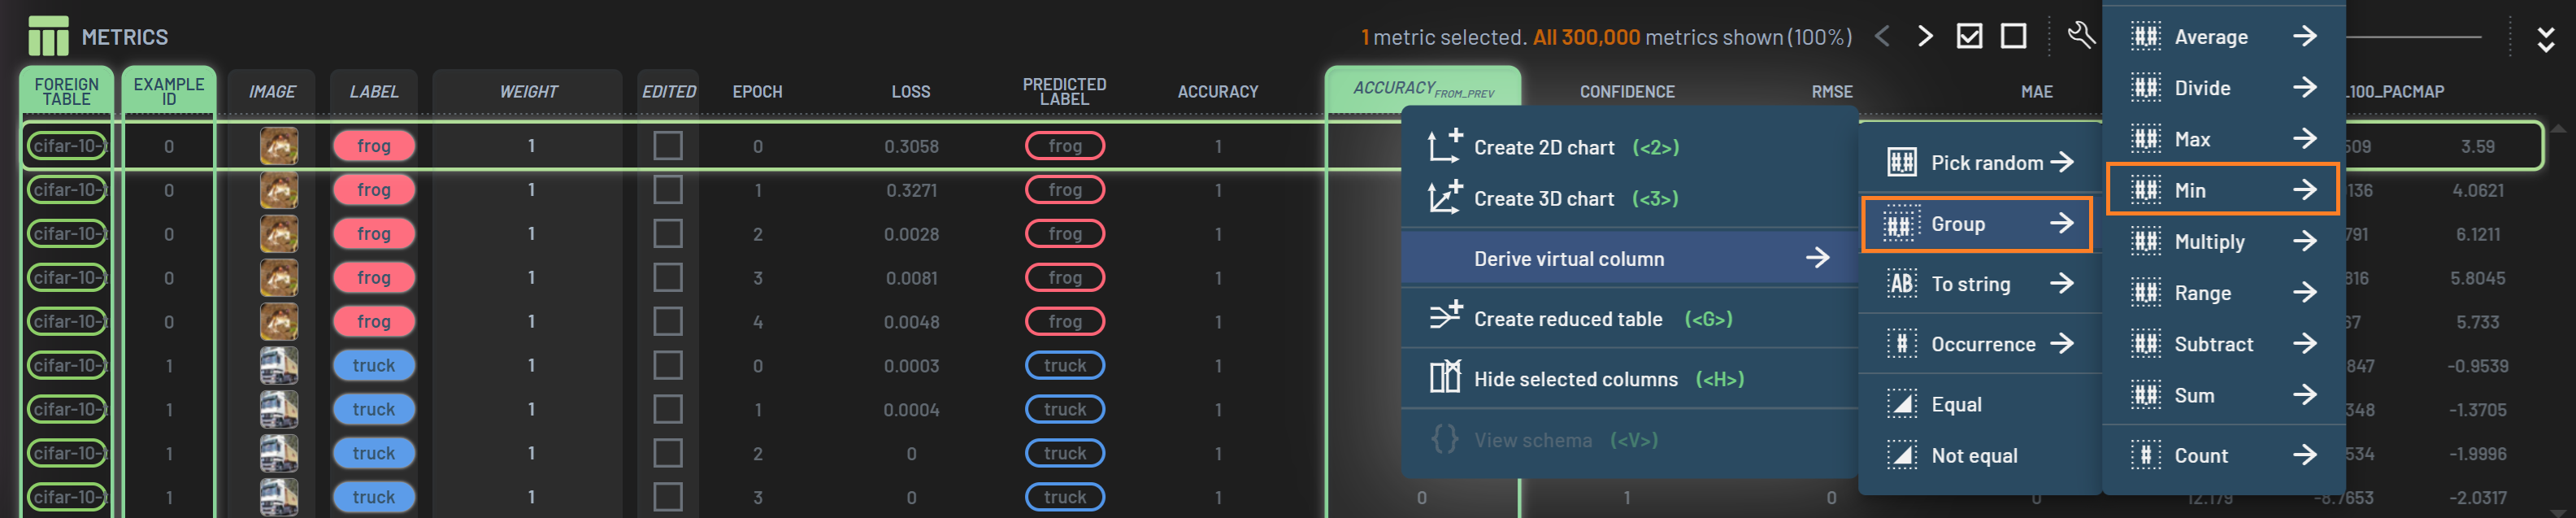
hide a column, RightClick on the column’s header and click Hide -> Selected column in the popup
menu, or press H after selecting a column, or directly MiddleClick on a column
header. You can hide multiple columns at once by selecting multiple columns followed by the hiding operation. You can
also hide unselected columns by clicking Hide -> Other columns in the popup menu or pressing
SHIFT + H.
To show a hidden column, click the wrench icon on the table’s toolbar and click the eye icon next to the column’s name in the popup menu. Column names with an open eye are those that are shown, whereas those with a closed eye are hidden. Note: some columns’ names may be nested in another column as indicated by an arrow. For example, the Image column is nested in the Example ID.
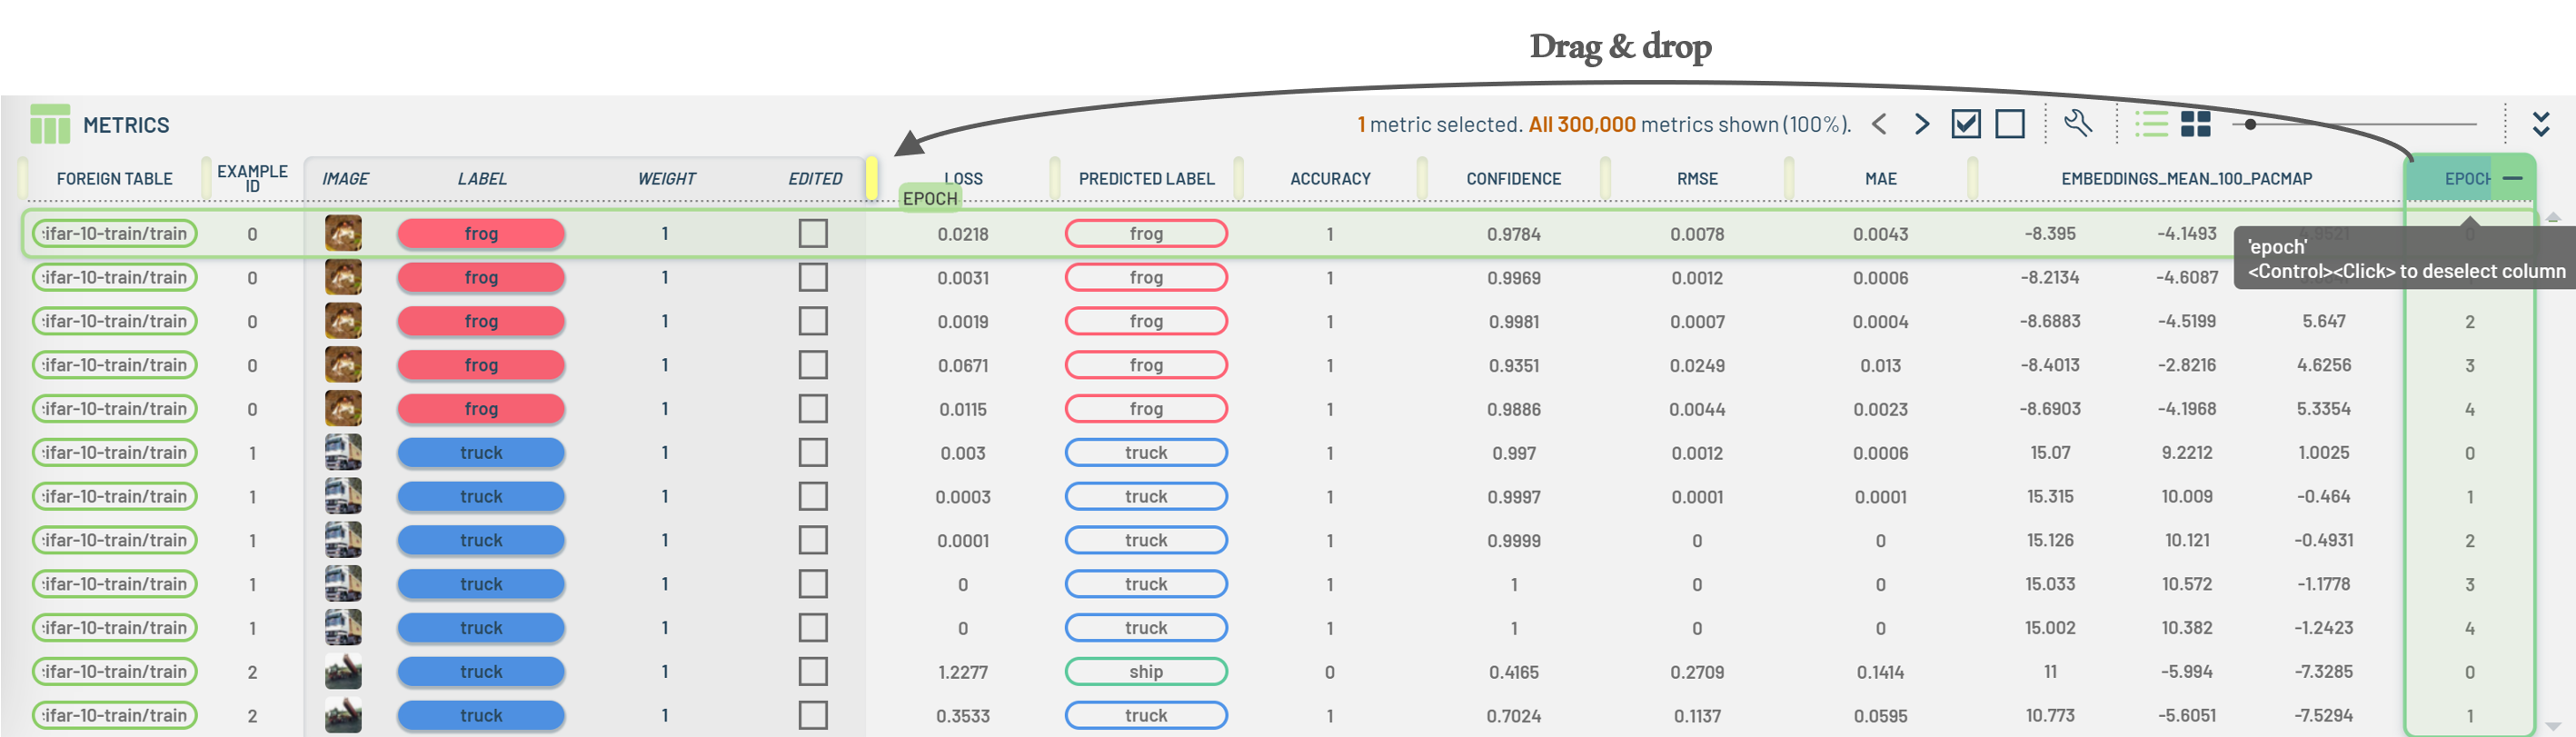
Re-ordering columns
To re-order a column, you can drag and drop the column header to a desired location. All available locations for the column are marked by a dark yellow bar when you start to drag the column.
Note: The order of the filters in the Filters panel is aligned with the order of the corresponding columns in the Rows panel. Therefore, re-ordering columns will also result in re-ordering filters.
Copying values
To copy values from the Rows panel, (multi-)select the columns and rows that you want to copy the values from, then
RightClick on one of the selected rows to bring up the popup menu, and select Copy values as CSV,
JSON, or raw text format. The values will be copied to the clipboard, which can be pasted into other files.
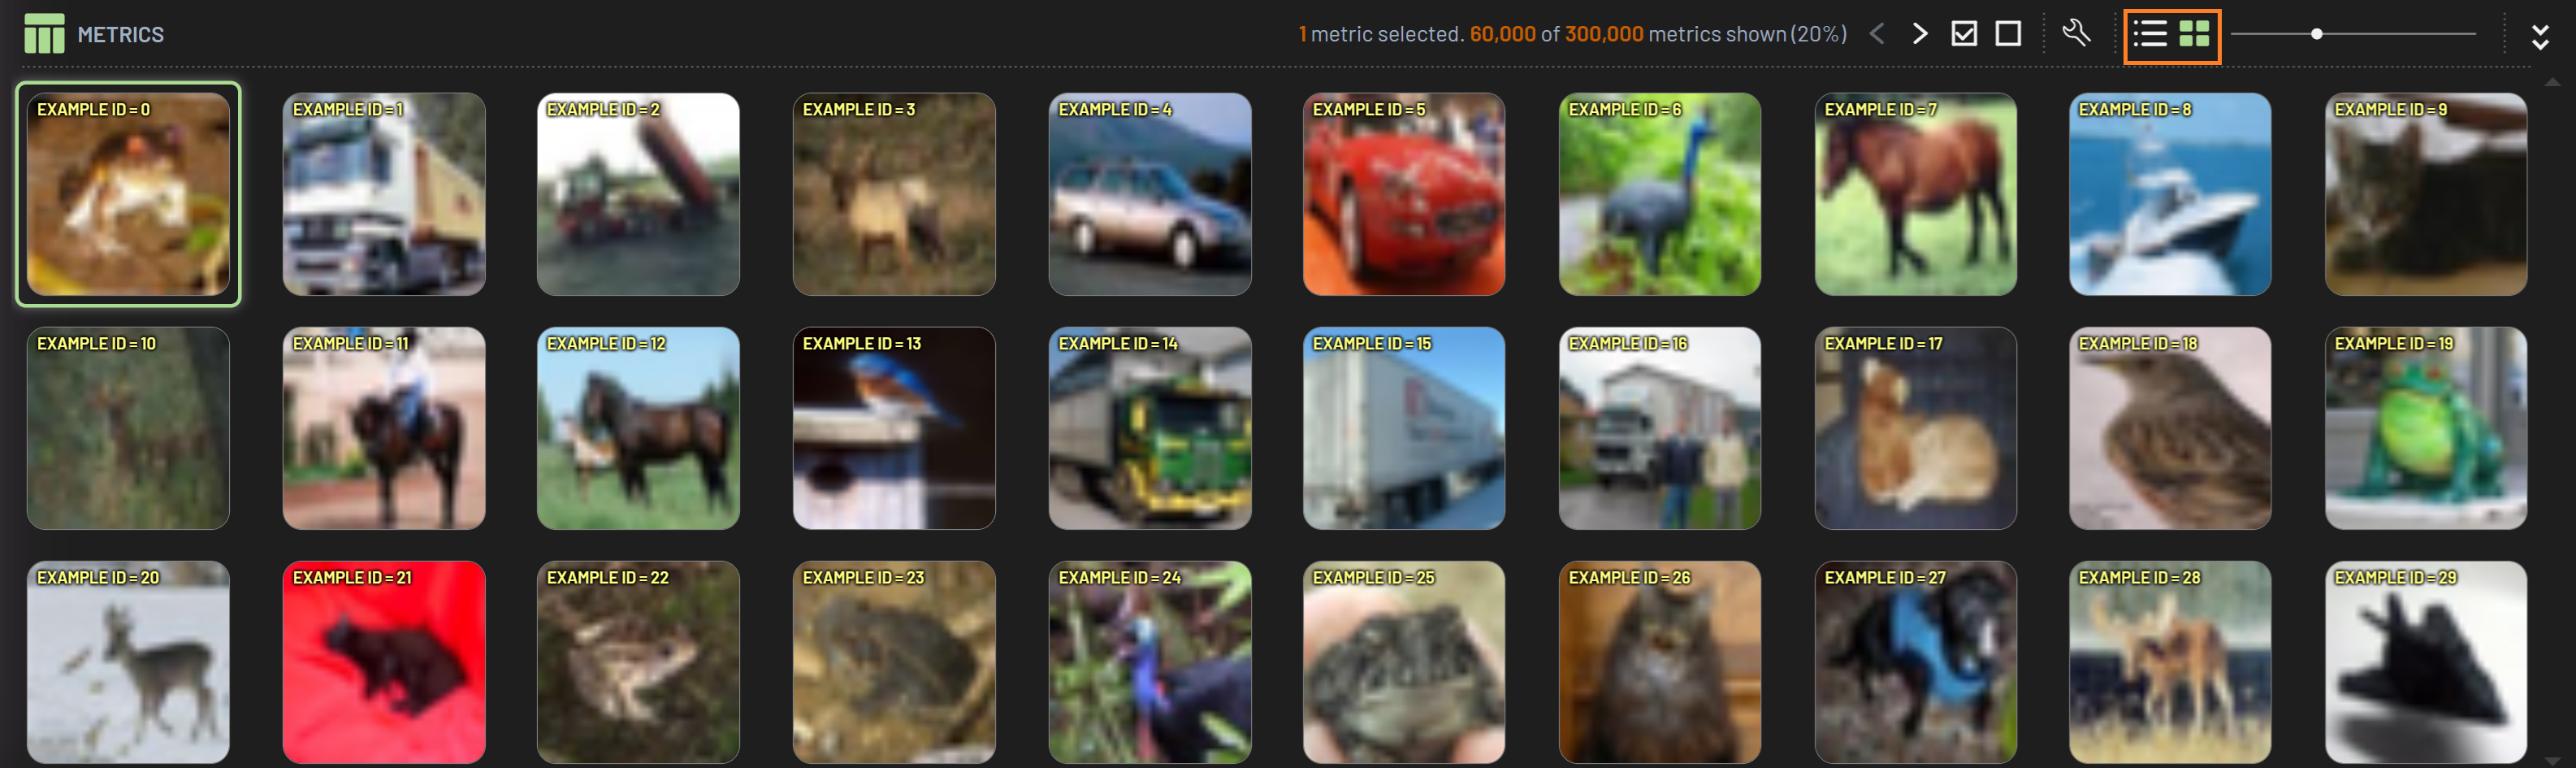
Grid View
To change the Metrics/Examples panel from list view to grid view, click the Grid view icon on the panel’s toolbar.
Click the List view icon to go back to the list view. The grid size or table row size can be adjusted via the slider
next to it.
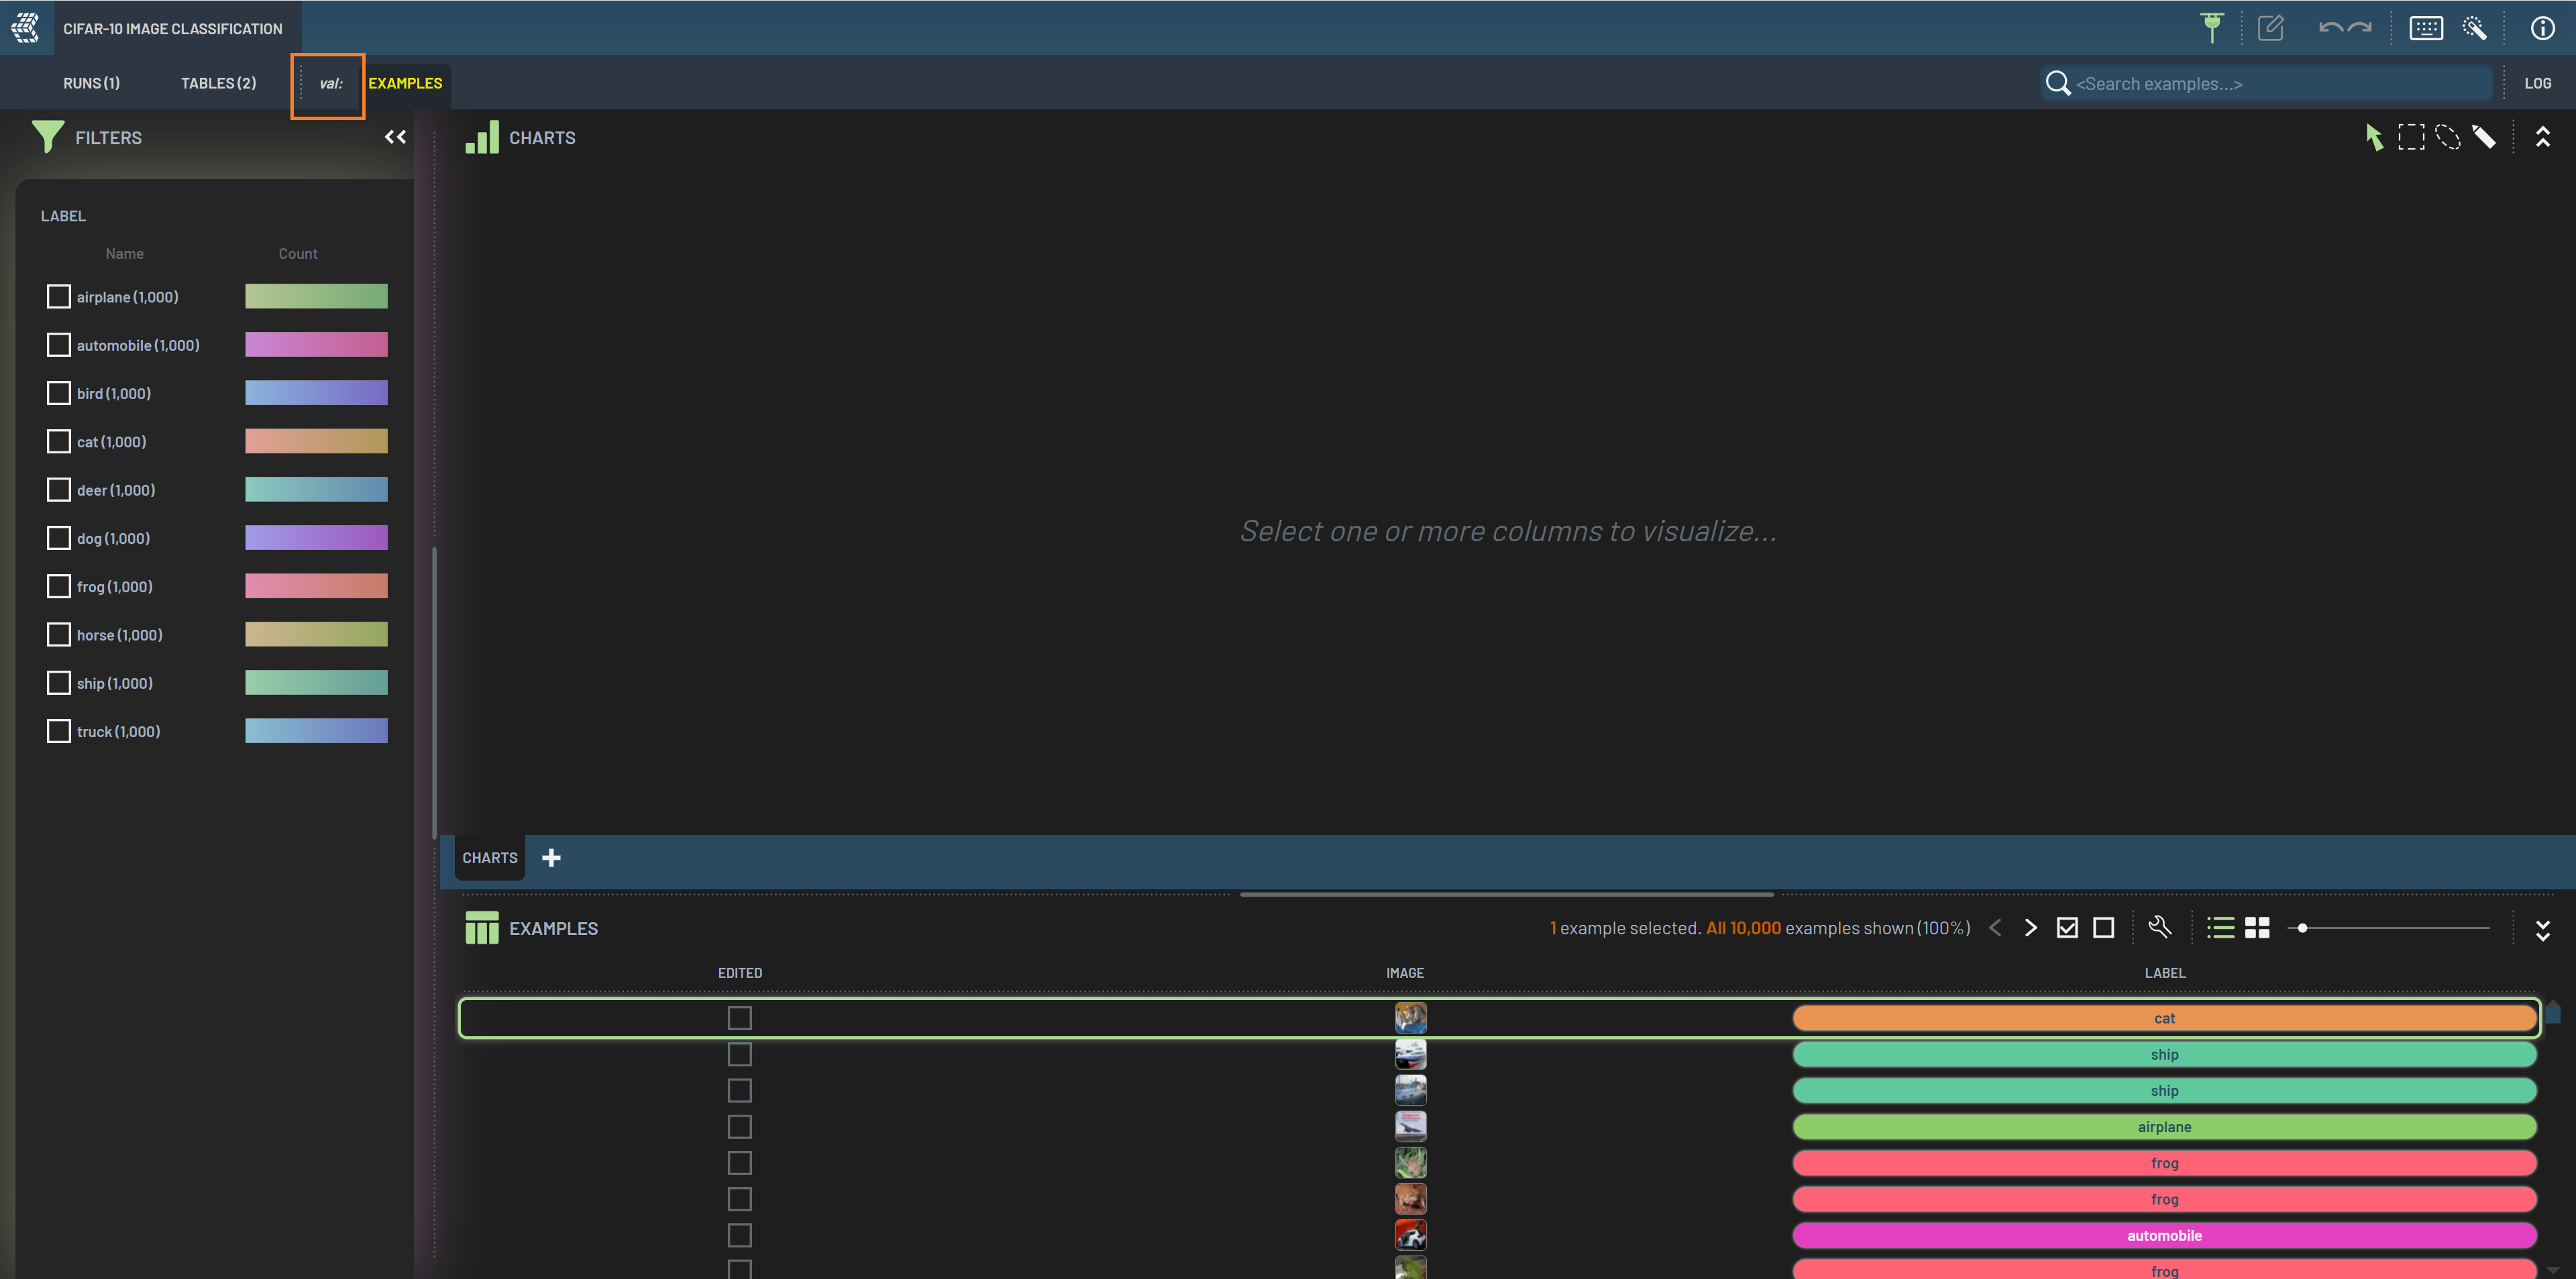
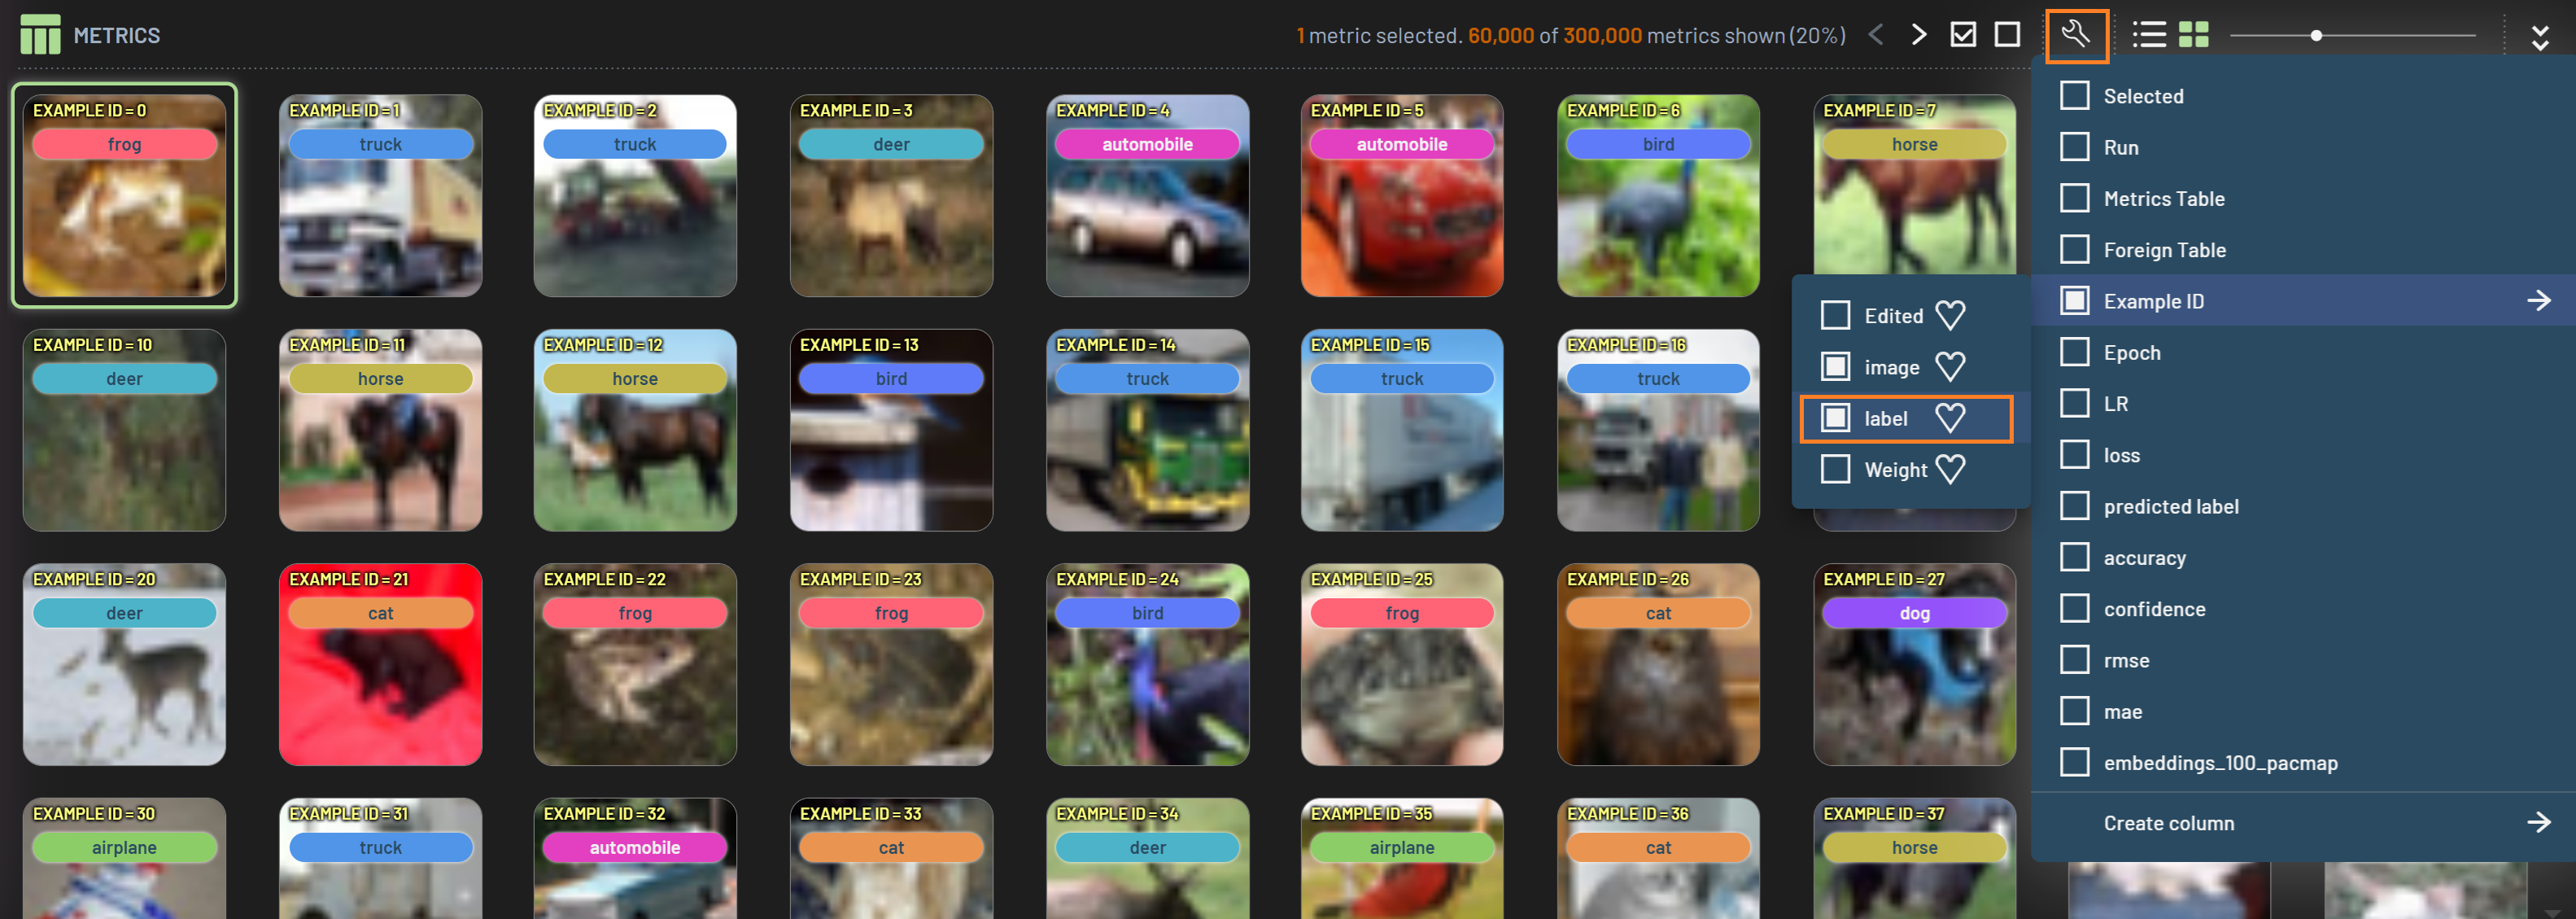
Column values can be overlaid on the images in grid view. Click the Configure/add columns wrench icon to choose
columns to display on the images. The screenshot below has a categorical Label column toggled on.
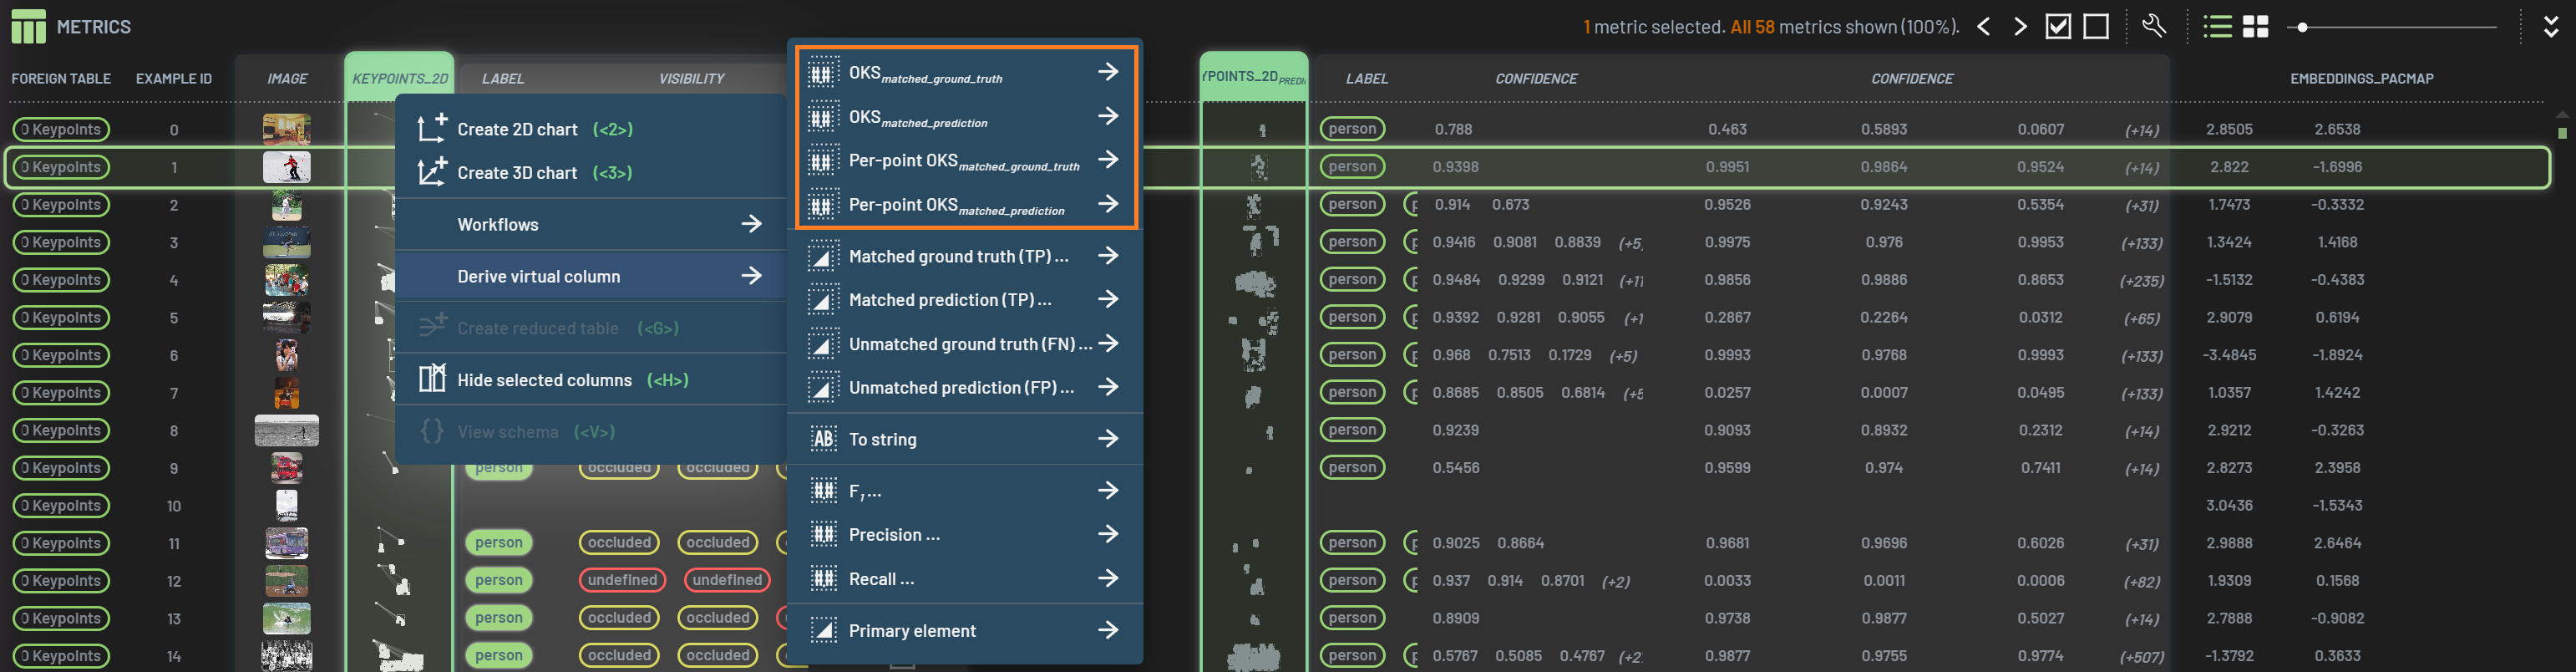
Creating new editable columns
In the Metrics panel for a Run or the Examples panel for a Table, you are able to create and edit an editable column. The values in an editable column are in white, whereas those in a uneditable column are in grey.
Create an editable column
On the Metrics/Examples panel toolbar, click the Configure/add columns wrench icon to bring up the menu, and select a
column type you want to add when hovering over Create column.

Specify a name for the column and click OK.
Edit an editable column
The string column named Tag is added in the metrics table, and you are able to edit the cell values. Type in a value and press Enter to complete the editing. To assign the same value to a number of rows, you can select these rows before assigning the value to one of the selected rows. The edited cells have a yellow background.