Semantic Segmentation
Image segmentation is a fundamental computer vision task that divides images into meaningful parts by assigning labels to individual pixels. This enables machines to understand the content and structure of images at a detailed level.
3LC supports two main types of segmentation. Semantic segmentation assigns class labels to pixels (e.g., all ‘car’ pixels get same label), focusing on what object types are present in the image and where. See Instance Segmentation for instance-level segmentation.
Data Format
In 3LC, semantic segmentation labels are stored as referenced Bulk Data. For each image, the label mask column contains a URL reference to a single-channel mask stored as a grayscale PNG.
Creating Tables
The first step when working with Semantic Segmentation data is to create a Table with image and mask columns. To
create an image column, see Image. A mask column can be described using the
tlc.SegmentationImagePath SampleType, which should be used
when the provided data is in the form of URLs to existing PNG masks. If instead the data is provided as a
PIL Image, the tlc.SegmentationPILImage SampleType can be used.
Visualization and Editing
How to edit a semantic segmentation mask
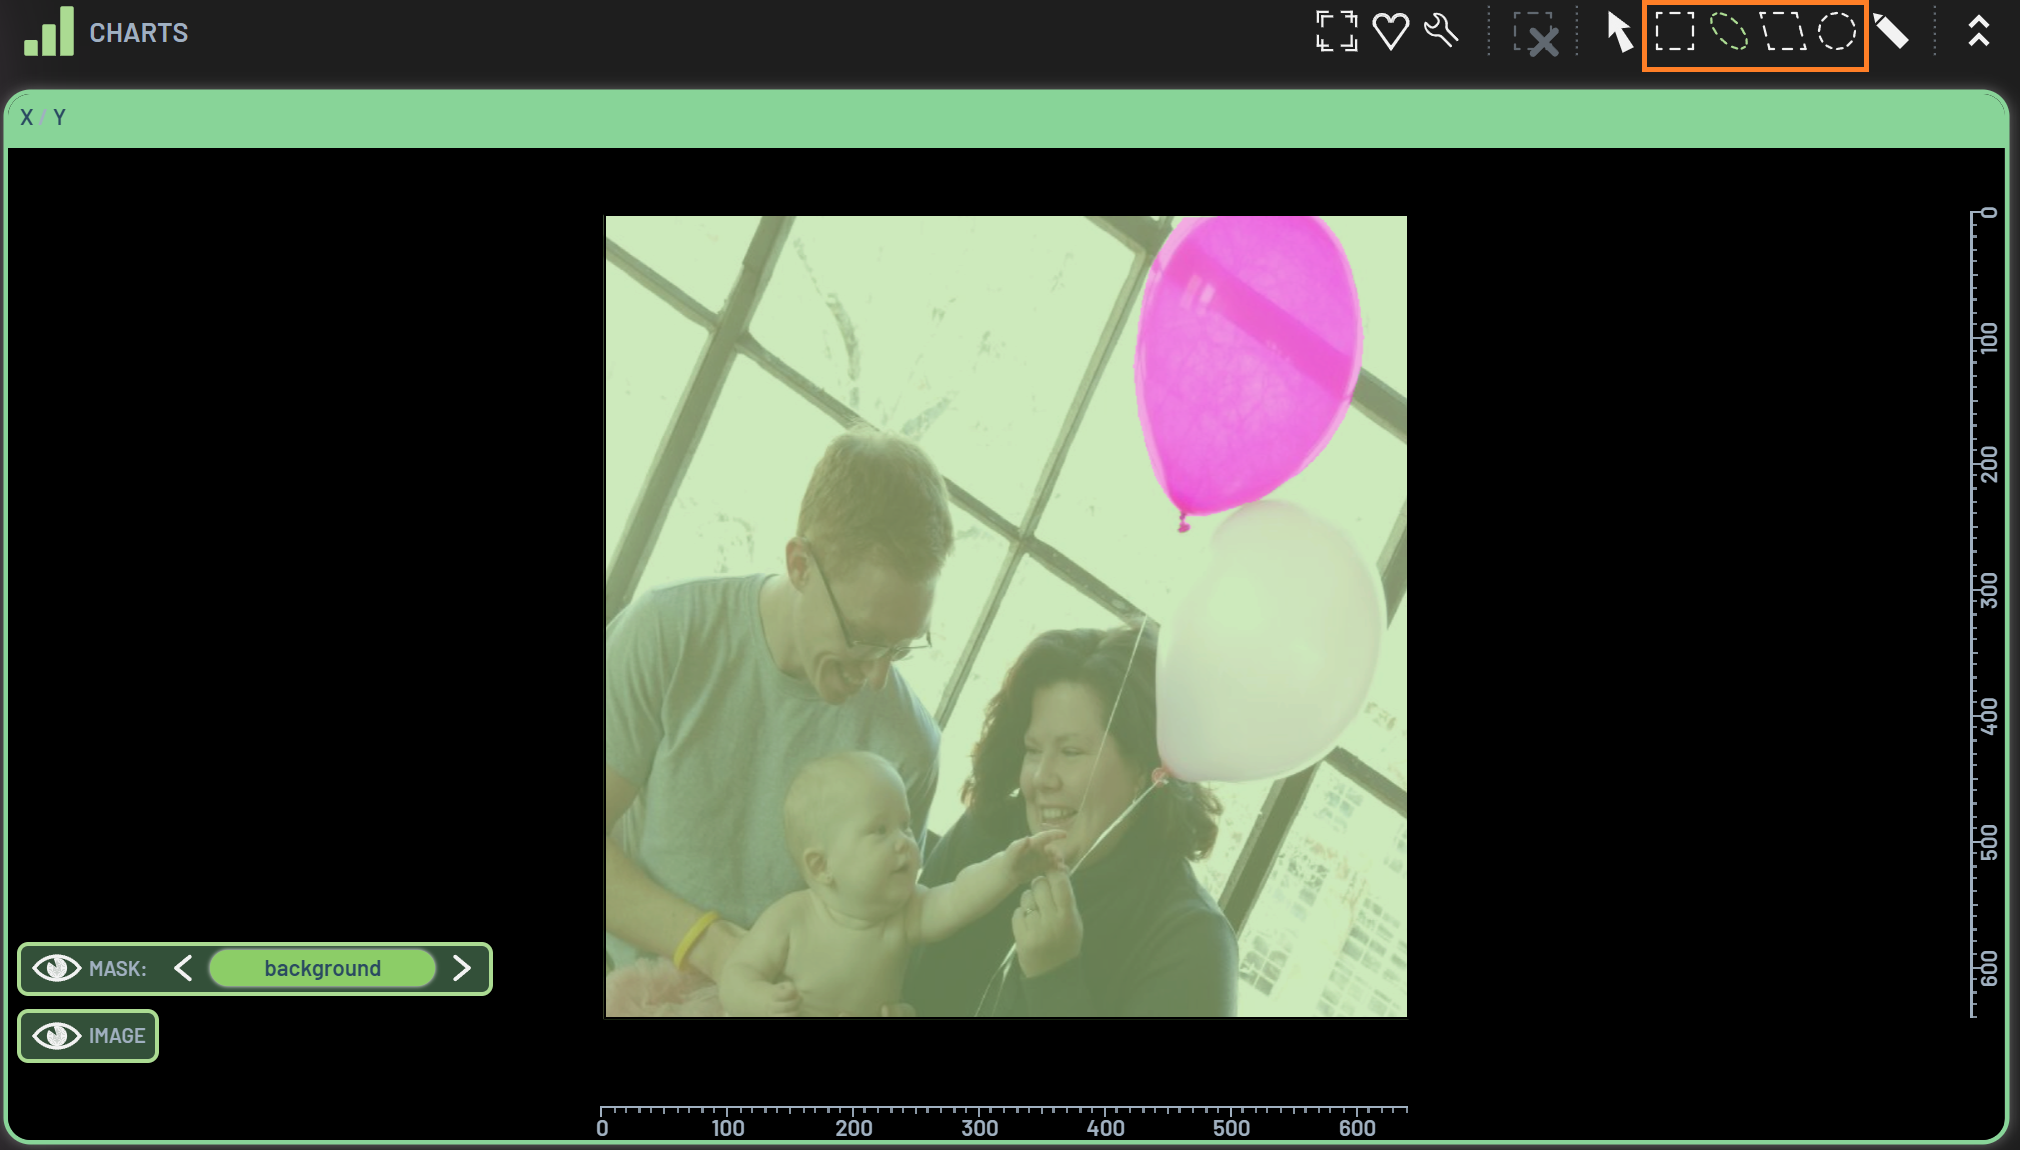
Mask editing utilizes the polygon selection tools in the Chart panel to paint on the mask. In order to edit a mask, a mask chart needs to be created first. Creating a mask and image overlay chart is similar as creating a BB and image overlay chart. Select the Mask and Image columns and press 2 to create the overlay chart. If you just want to create a mask chart without the image, you just select the Mask column and press 2.
When using a polygon selection tool on a mask chart, the polygon selection tool will be served as mask editing.
To start editing a mask, select one of the polygon selection tools such as lasso, select a desired label (balloon in this example), and then start drawing the lasso polygon to trace the balloon on the image.
To select a desired label, there are three options:
Click the label name next to the
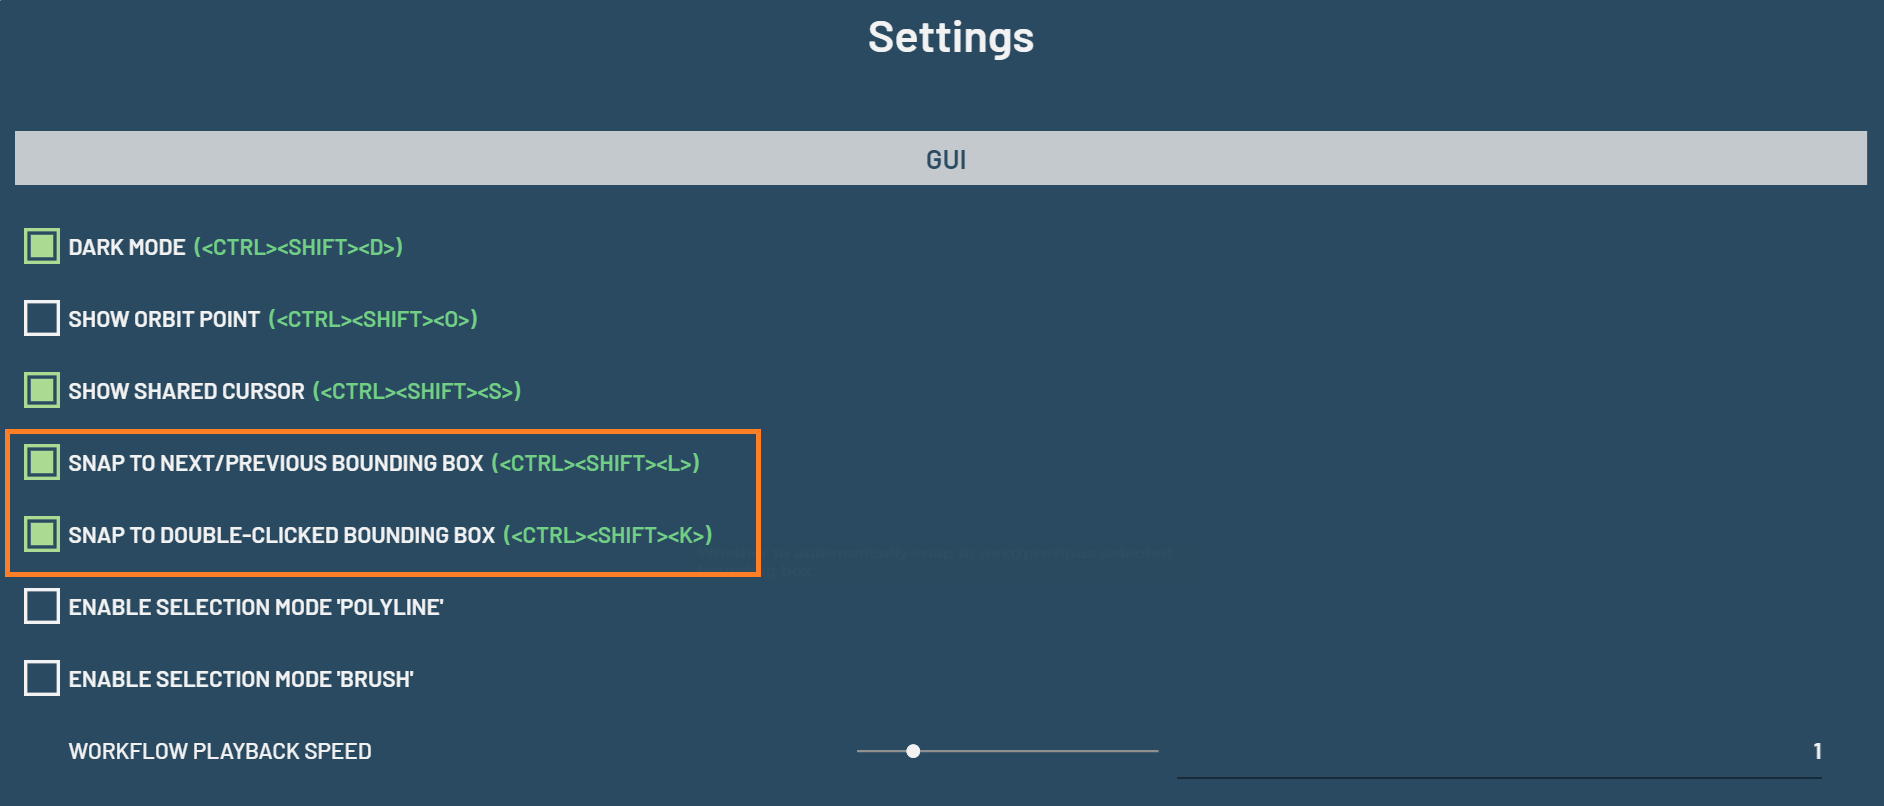
MASKcontext menu on the lower left corner of the chartPress K or L to go to the previous or next label until the desired one is reached
Press J when the mouse cursor hovers over an area of the desired label on the mask
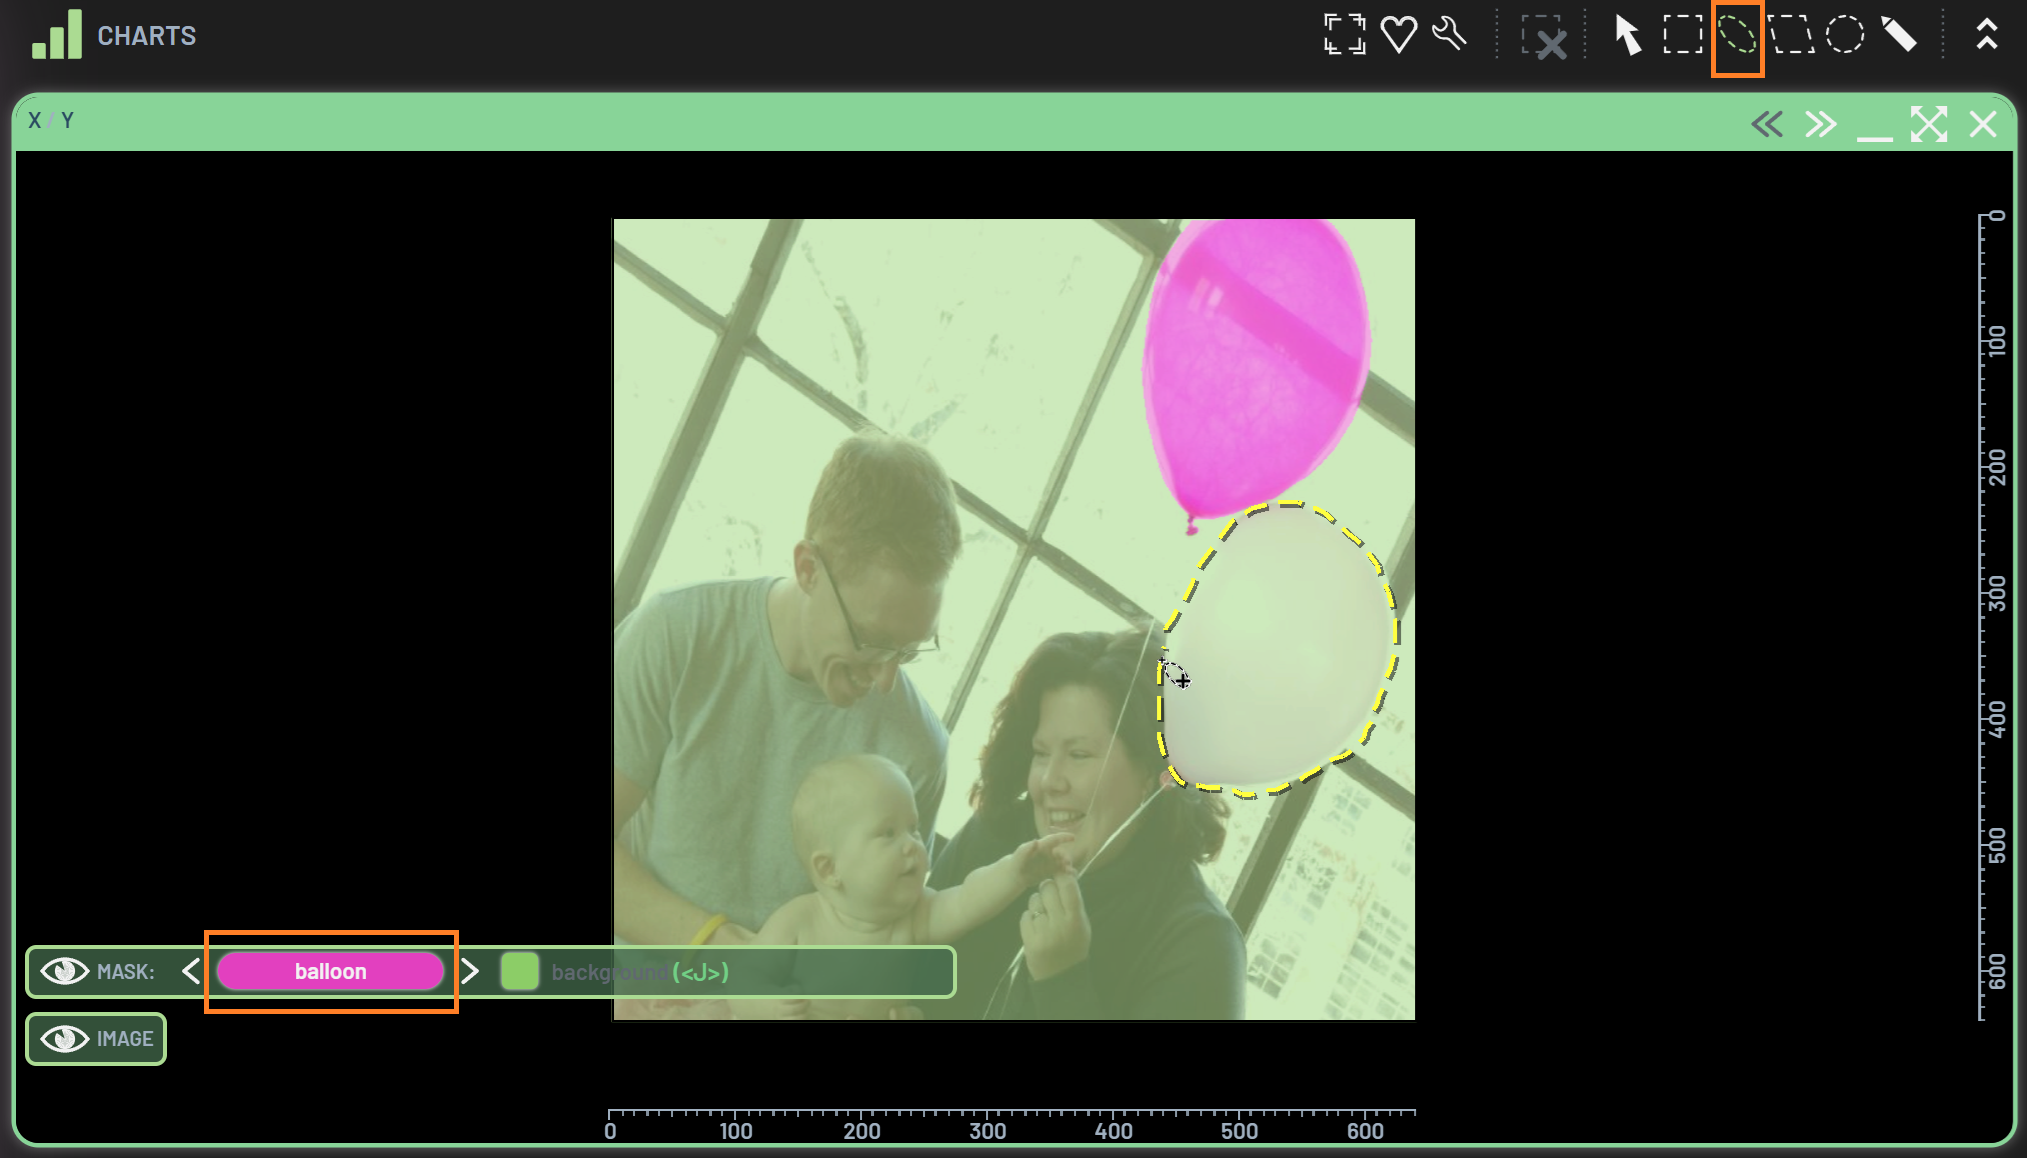
The lasso polygon area will be painted as the color of Class balloon once the lasso drawing is complete. You may want to finetune the edges of the newly painted mask, if they are not perfect, by zooming in and repeating the same painting process.
Accept predictions
You can convert a model’s predicted mask to a ground truth mask. To do this, first create an image + predicted mask chart,
then RightClick to bring up the context menu and click on Immediately accept predictions this row
or press I to accept the current sample’s
predicted mask as the ground truth. The ground truth mask will be updated to be the same as the predicted one.
You can accept the predicted masks for all filtered-in samples at once by dragging the Predicted_mask column header to
the Mask column header.