Images
Most Computer Vision models are trained to identify relevant features and reason about the contents of images. When working with Computer Vision data in 3LC, at least one image column is therefore usually present in the Tables you create.
Creating Tables
Tables usually store URL references to images without copying them from their original
locations. In 3LC this is referred to as Bulk Data. The Schema therefore declares that it
is a string with the role "URL/Image" to communicate that it points to an image, such that the Dashboard knows to
visualize it as such.
import tlc

table = tlc.Table.from_dict(
    data={"image": ["path/to/image0.png", "path/to/image1.png", ...]},
    structure={"image": tlc.ImageUrlSchema()},
)
import tlc

table = tlc.Table.from_dict(
    data={"image": ["path/to/image0.png", "path/to/image1.png", ...]},
    structure={"image": tlc.Schema(value=tlc.StringValue(string_role=tlc.STRING_ROLE_IMAGE_URL))},
)
import tlc
from PIL import Image

table = tlc.Table.from_dict(
    data={"image": [Image.open("path/to/image0.png"), Image.open("path/to/image1.png"), ...]},
    structure={"image": tlc.PILImage},
)
Image Format Support
Since 3LC Tables store references to images, rather than the images themselves, any image format can be referenced in the Table. The Dashboard is however limited to displaying the formats supported by your web browser. In practice, this means that most common formats can be displayed. For a useful guideline, see the Wikipedia comparison of web browser image format support.
In addition to those supported by your web browser, 3LC supports on-the-fly transcoding of certain formats such that they can be visualized in the Dashboard. Currently, the following cases are supported:
TIFF: Single-frame TIFF images are transcoded to PNG format.
NumPy: Referenced
.npyfiles are instantiated, and when the array is 2D or 3D with a third dimension of 1 (grayscale), 3 (RGB), or 4 (RGBA) channels, it is transcoded to PNG format.
Note that in all cases, the Schema must declare that the column contains image URLs for transcoding to work. For example, transcoding is not invoked for referenced files without the Image URL role.
Exif Orientation
Exif (exchangeable image file format) is a standard for storing metadata in images. In the Dashboard, images with Exif orientation tags are always visualized in the canonical orientation, meaning rotations/flips are applied such that the images are displayed upright.
Therefore, when storing annotation columns, it is important that these (and any other data such as image dimensions) are
stored in the canonical orientation. For image dimensions, many commonly used methods like
PIL.Image.size are not based on Exif data, and will not return dimensions in the
canonical orientation for certain Exif orientations. To get image dimensions in the canonical orientation, you can use
the helper tlc.ImageHelper.get_exif_image_dimensions()
which we use internally.
As a further step it is possible to rotate/flip your images to the canonical orientation and remove the Exif orientation
tag from the file. This removes all ambiguity about the orientation of the image, and can be done using
PIL.ImageOps.exif_transpose().
Several importer methods create Tables with an image column,
notably tlc.Table.from_image_folder(),
tlc.Table.from_coco() and
tlc.Table.from_yolo_url(). The free-form methods can also be used
by declaring the image schema and providing the images as a list of URLs, like in the examples above.
Visualization
The Dashboard provides several ways to visualize image data.
Charts
To create an image chart, select the IMAGE column (click the column header),
RightClick on the IMAGE column header, and select Create 2D Chart on the popup
menu. Alternatively, you can press 2 after selecting the IMAGE column.
Viewing images in the Charts panel is useful when you want to visualize images from a single row, and is often visualized with an overlay of geometric labels or predictions, such as bounding boxes or keypoints.
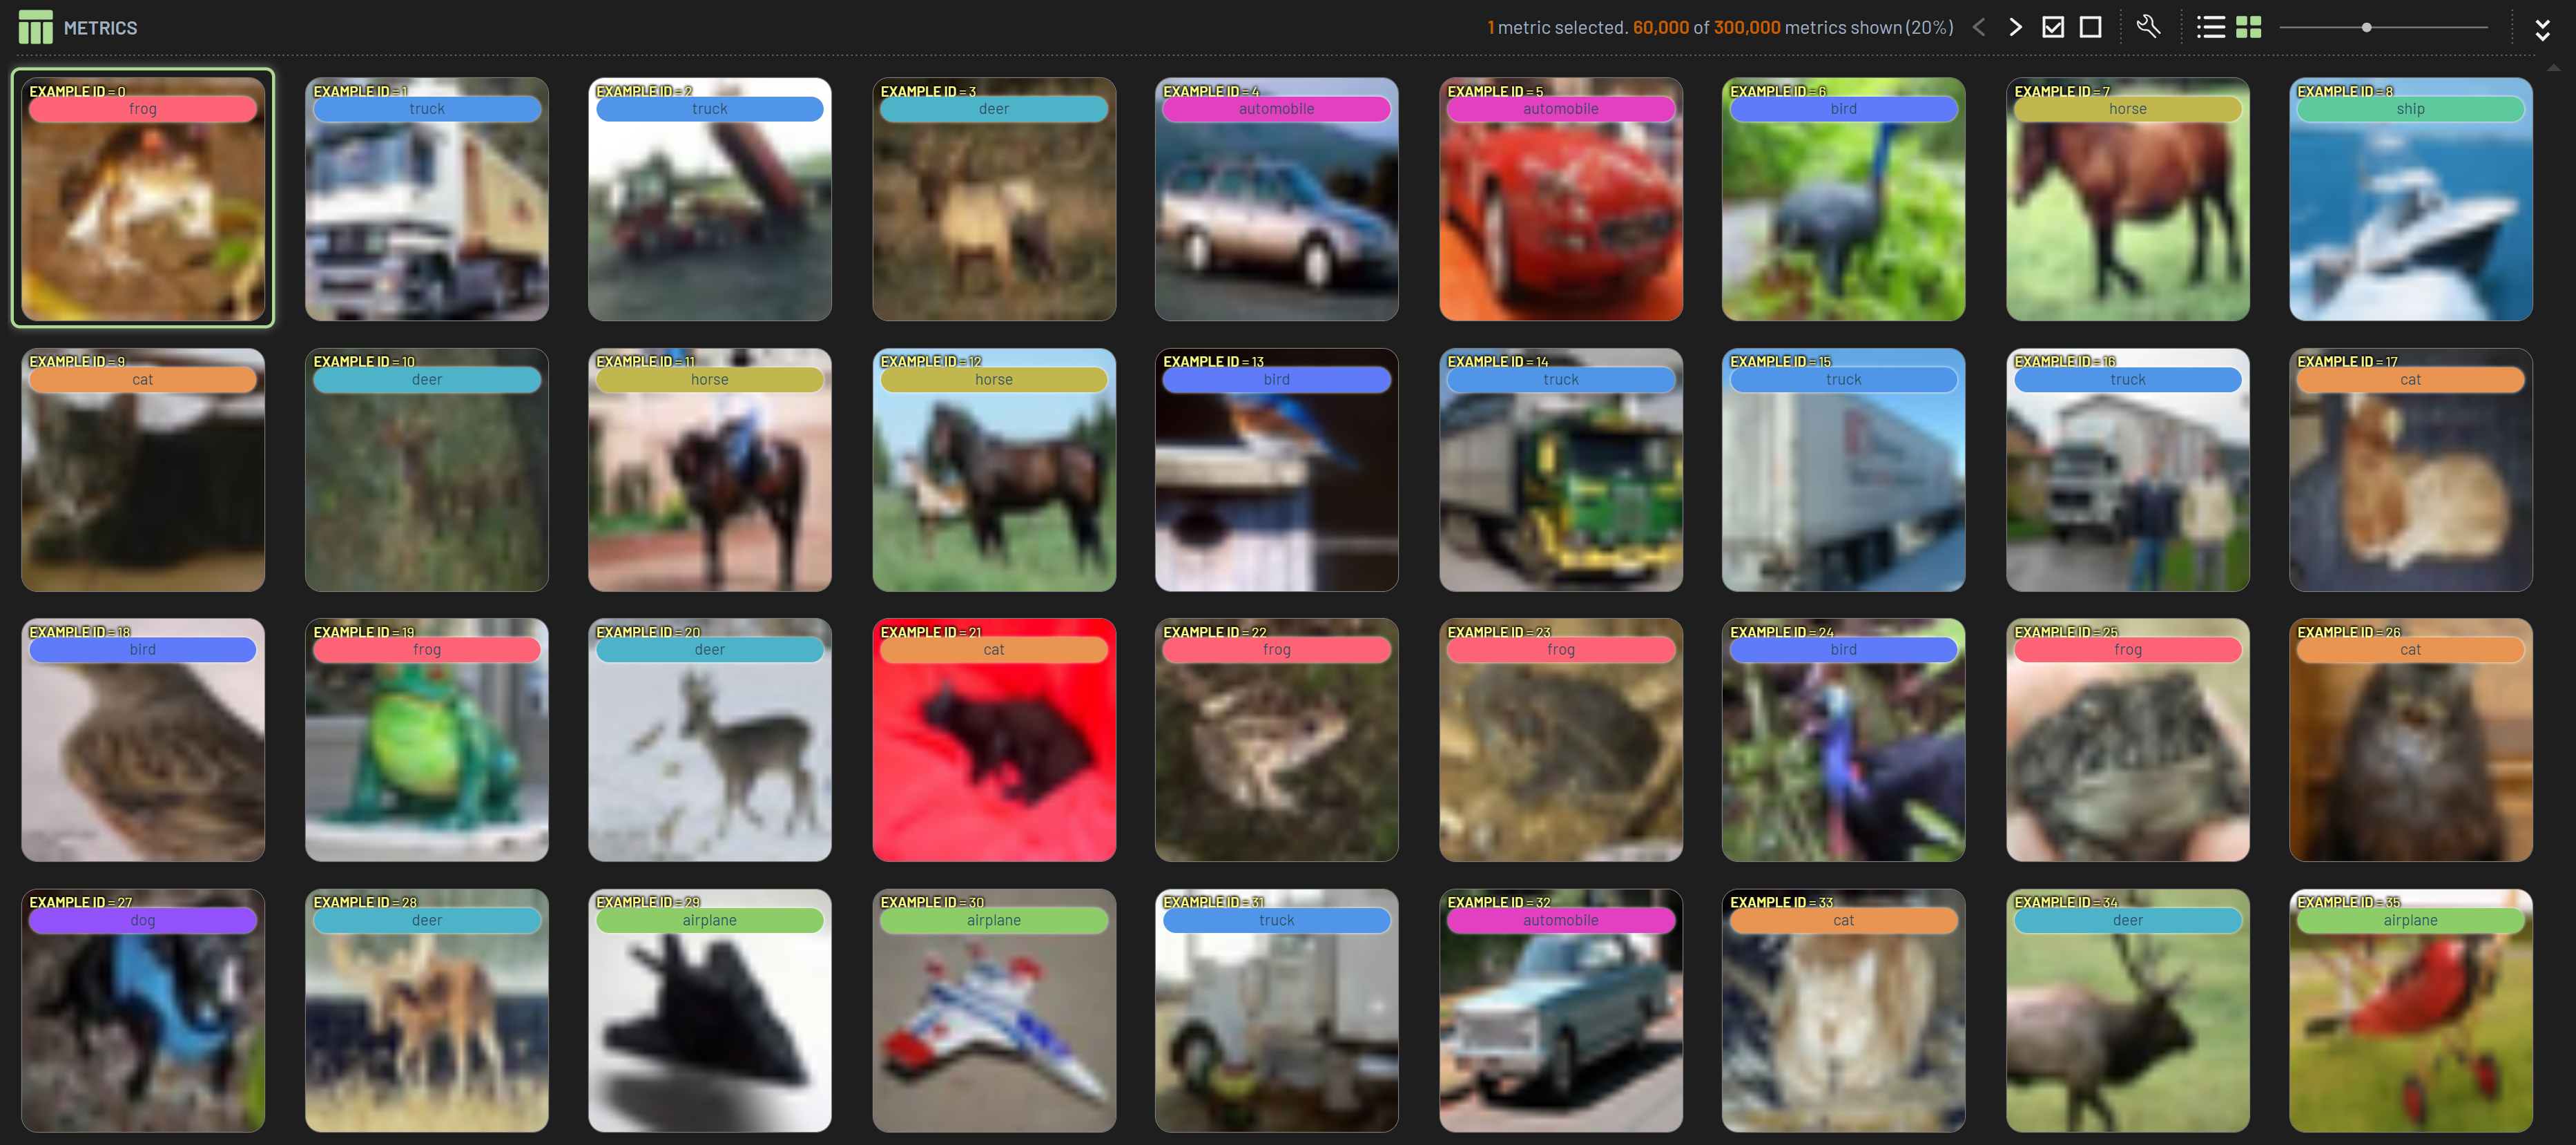
Grid View
It is also possible to change the tabular view of the Rows panel and show the rows as a grid. This shows all of the images in a single grid, allowing you to view several at once.
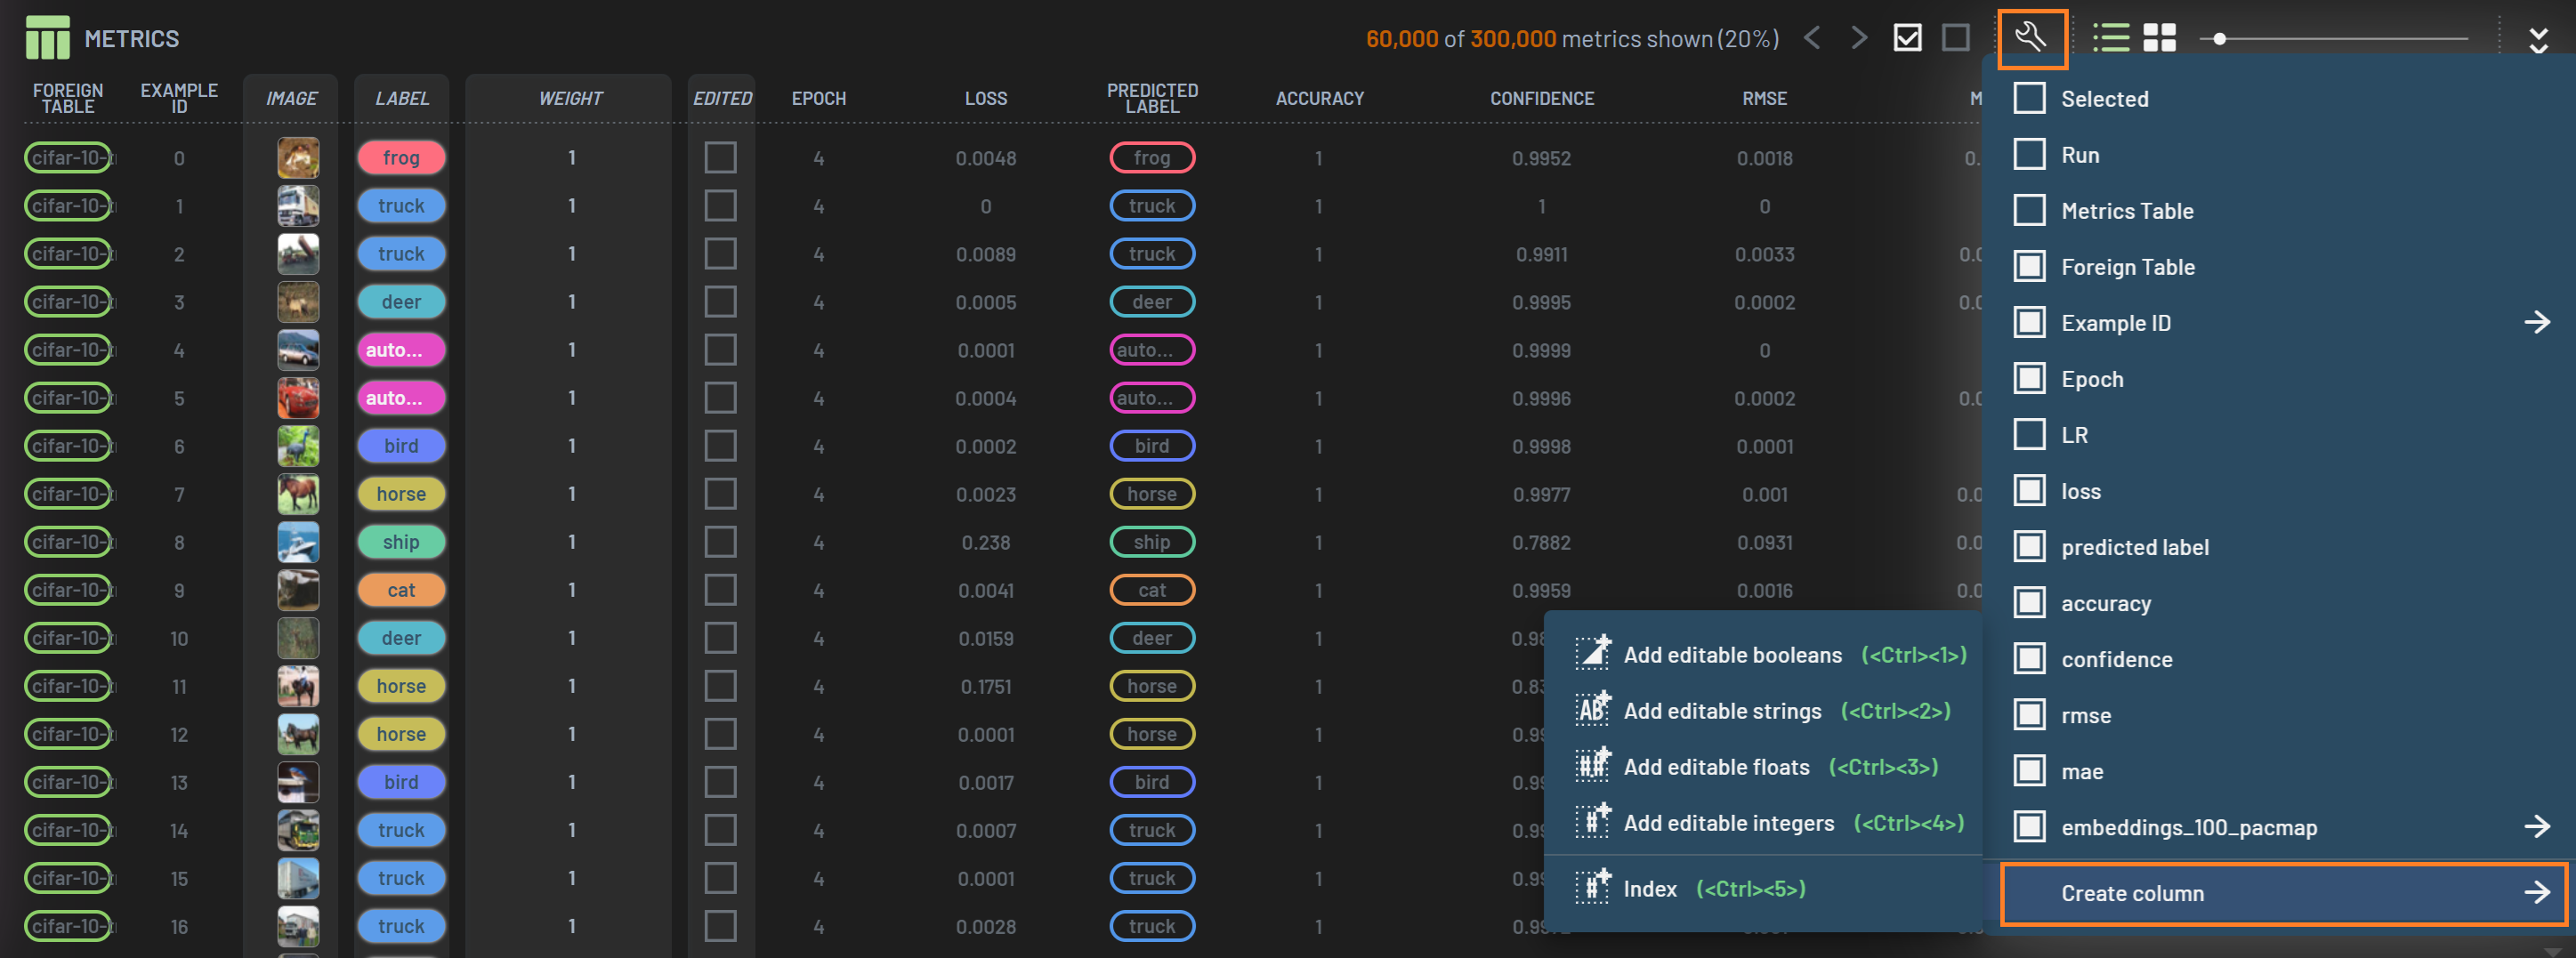
Virtual Columns
While images are mostly used for creating charts alongside additional data, it can be useful to derive the string representation of the image as part of debugging where images are stored, why they are not being displayed or if they have aliases. Check the FAQ for how this can be used.