Dashboard
The 3LC Dashboard is where you will spend most of your time when using 3LC. The Dashboard lets you visualize your Tables and Runs, query your data based on filters, and modify samples within your dataset, all from your browser.
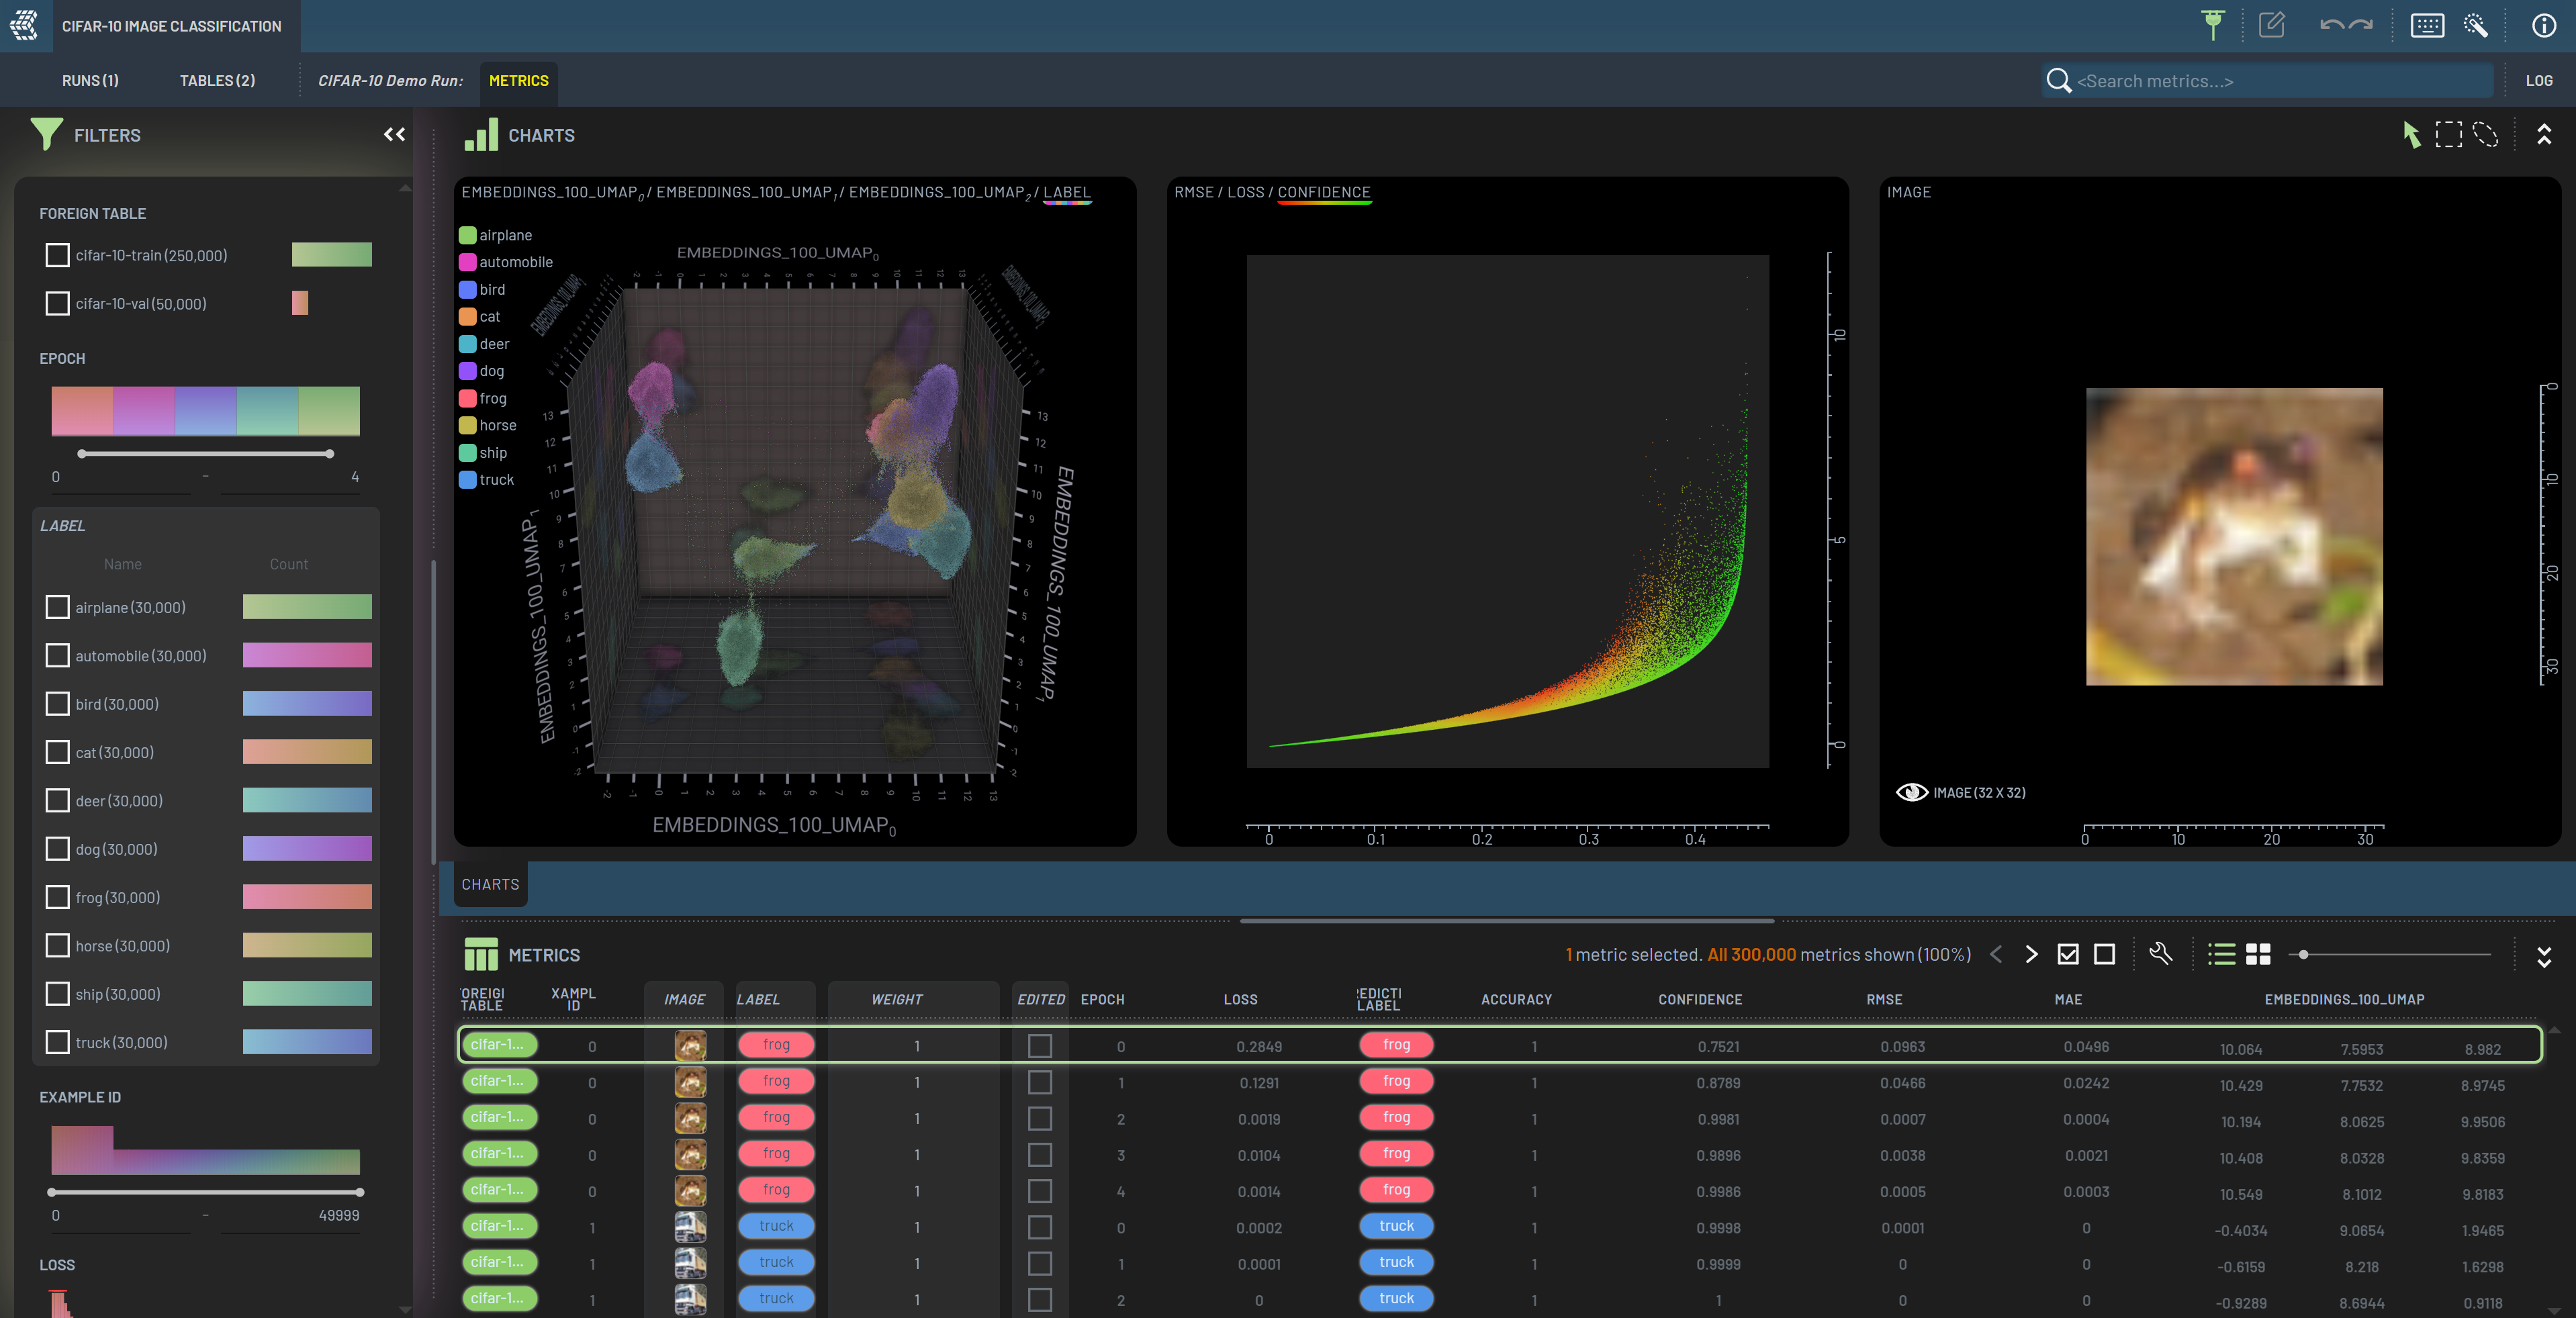
The Dashboard always shows a View of tabular data in the Rows panel at the bottom of the screen. This data can be visualized in the Charts panel and filtered on in the Filters panel. When opening the Dashboard, the initial view shows a list of available projects. Double clicking a project opens it, and allows you to view the Runs and Tables within the project.