Keyboard Shortcuts
The Dashboard has a number of keyboard shortcuts for a common operations. Some of these shortcuts are always available, while others are only available when you have one or more columns, rows or chart windows selected.
You can find all shortcuts by clicking the Show cheat sheet icon on the upper right corner of the
Dashboard.
The Dashboard cheat sheet contains all shortcuts. Click or press the modifier keys (Shift and/or Ctrl) to see further shortcuts that use the modifiers. You can also search a shortcut name to find the hotkeys. The cheat sheet can be moved by dragging the title bar.
For completeness, the shortcuts are also listed below here:
Global shortcuts
Modifiers |
Key |
Action |
|---|---|---|
0 |
Show Settings window |
|
Ctrl |
0 |
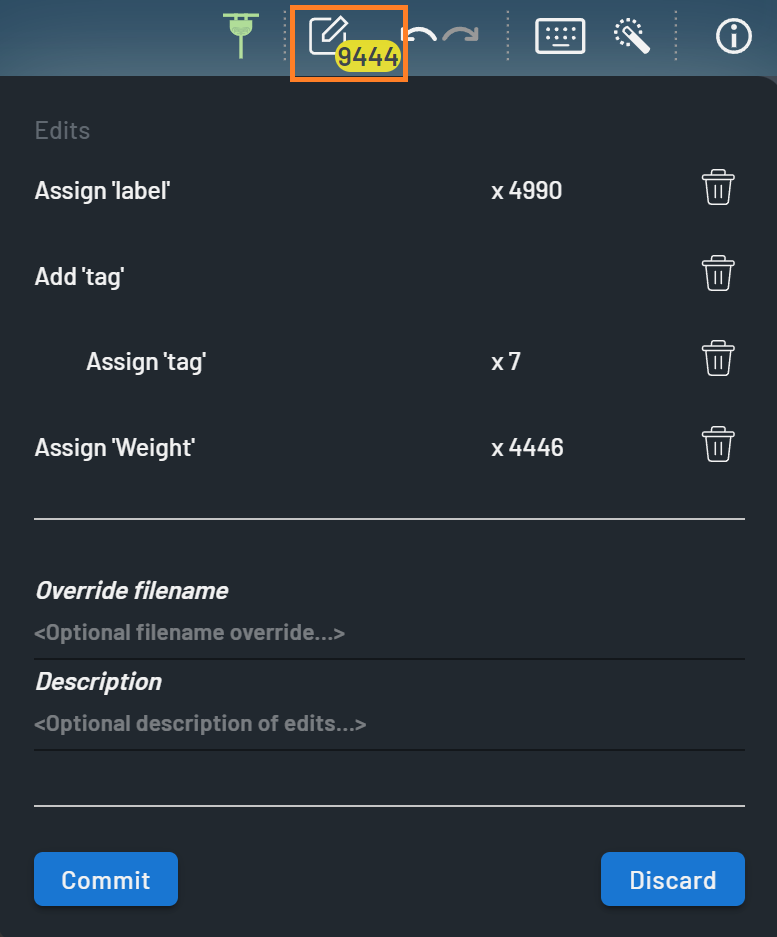
Create user-defined workflow which will recreate the selected virtual columns and/or charts |
1 |
Toggle ‘Show filtered out elements’ |
|
Alt |
1 |
Copy operation docs to clipboard |
Ctrl |
1 |
Create new editable column (bool) |
Ctrl |
2 |
Create new editable column (string) |
Ctrl |
3 |
Create new editable column (float32) |
4 |
Toggle all mask images on/off |
|
Ctrl |
4 |
Create new editable column (int32) |
5 |
Toggle all images on/off |
|
Ctrl |
5 |
Create global table row index column |
6 |
Toggle manual labels on/off |
|
Ctrl |
6 |
Create filtered table row index column |
7 |
Toggle predictions on/off |
|
Ctrl |
7 |
Create random value column |
8 |
Show Workflows window |
|
9 |
Show the keyboard cheat sheet |
|
A |
Select all list elements selected row |
|
Shift |
A |
Deselect all table elements |
Ctrl |
A |
Select all table rows |
B |
Immediately accept all predictions |
|
Shift |
B |
Set List mode |
Ctrl |
B |
Accept all predictions |
Alt |
Backspace |
Undo last edit |
ShiftAlt |
Backspace |
Redo last undone edit |
Ctrl |
Backspace |
Discard all pending edits |
C |
Show/hide Rows panel |
|
D |
Clear all filters |
|
Shift |
D |
Toggle ‘Dark mode’ |
E |
Filter using Lasso tool |
|
Shift |
E |
Toggle ‘Expert mode’ |
Ctrl |
Enter |
Commit all pending edits |
Esc |
Deselect all table elements |
|
F |
Create subset table from the currently filtered table elements |
|
F1 |
Show Help page |
|
G |
Create reduced table given the currently selected columns |
|
Shift |
G |
Clear polygon selections |
I |
Immediately accept predictions this row |
|
Shift |
I |
Immediately reject predictions this row |
Ctrl |
I |
Accept predictions this row |
J |
Toggle ‘Erase all other layers’ |
|
K |
Cycle value down |
|
L |
Cycle value up |
|
Shift |
Left |
Reselect previous |
M |
Immediately accept selected predictions |
|
Shift |
M |
Toggle ‘Color lookup tables’ |
Ctrl |
M |
Accept selected predictions |
N |
Immediately reject selected predictions |
|
Shift |
N |
Set Grid mode |
O |
Toggle ‘Override image resolution’ |
|
Shift |
O |
Immediately reject all predictions |
Ctrl |
O |
Cycle ‘Image interpolation mode’ |
P |
Tweak selected Runs/Tables |
|
Shift |
P |
View selected Runs hyperparameters |
Q |
Pan/rotate viewport |
|
R |
Filter using Polygon tool |
|
Shift |
Right |
Reselect next |
S |
Toggle ‘Live filters’ |
|
Space |
Pan/rotate viewport |
|
T |
Filter using Paint tool |
|
U |
Paint bounding box |
|
Shift |
U |
Toggle ‘Automatically open Workflows window’ |
Shift |
V |
Edit value map |
W |
Filter using Rectangle tool |
|
Shift |
W |
Toggle ‘Ensure non-zero ‘weight’ after editing’ |
X |
Show/hide Charts panel |
|
Y |
Snap all 2D/3D windows to contents |
|
Ctrl |
Y |
Redo last undone edit |
Z |
Show/hide Filters panel |
|
Ctrl |
Z |
Undo last edit |
CtrlShift |
Z |
Redo last undone edit |