Collecting Metrics
One of the key features of 3LC is the ability to collect fine-grained metrics from input Tables. This guide outlines how to collect and accumulate per-sample and aggregate metrics to be analyzed in the Dashboard.
Per-Sample Metrics
Collecting per-sample metrics is at the core of the 3LC Workflow. It consists of running an inference pass, usually with your model, on both the training and validation Tables, and collecting the outputs and additional metrics like embeddings for each sample.
In the context of model training, per-sample metrics collection is often performed multiple times during training, as this gives useful information about how the model is learning from each sample over time.
There are two main ways to collect per-sample metrics:
Metrics Collectors
tlc uses the concept of a metrics collector, which is a mechanism that uses data and model output to produce metrics.
This can be as simple as a function that takes a batch of samples and a batch of predictions and returns a dictionary of
metrics. Information about the schema of the metrics can optionally be provided to the metrics collector to allow
customization of the metrics.
The tlc Python package includes a set of built-in collectors for common use-cases, but it is also easy to create
custom collectors to fit specific needs.
When collecting per-sample metrics using an ML model, it is often desirable to run just a single inference pass through
each dataset for metric collection. This is achieved by calling the
collect_metrics function, where you specify the model, the
Table, and the metrics collectors you want to use. This collection interface provides a high-level abstraction that
handles orchestration of calling the model and passing the output to the collection functions.
To control per-sample preprocessing, you can use the tlc.Table.with_transform() method to obtain a
non-mutating view that applies a transform on read. This enables you to apply validation-time augmentations for the
training and validation data during metrics collection, different from those applied during training.
"""Pseudo-code example of collecting per-sample metrics from a Table and a model."""
import tlc
import torch

table: tlc.Table = ...
model: torch.nn.Module = ...

def metrics_collector(batch, predictor_output):
    """Example of a metrics collector function.

    batch: A batch of samples from the Table (or `Table.with_transform(...)` view), collated by a torch.DataLoader.
    predictor_output: The output of the model for the batch.
    """
    return {
        "accuracy": [...]
    }

# The following command orchestrates a full inference pass through the Table,
# collecting metrics using the provided metrics collector(s) and updating the active Run.
tlc.collect_metrics(table, metrics_collector, model)
For more details on how to control the data flow and customize the inference and metrics collection process, see classes
Predictor and
MetricsCollector.
The metrics_collectors module provides a variety of
pre-defined metrics collectors, including:
To create your own metrics collectors, you have two options:
Subclass
MetricsCollector.Use the
FunctionalMetricsCollectorand provide a function with the signaturemetrics_fn(sample_batch, prediction_batch).
Free-form
The most basic way to collect per-sample metrics is to provide them directly to
run.add_metrics(). In free-form metrics collection,
you are responsible for performing the inference pass and collecting the metrics.
It accepts a dictionary of metrics as a mapping from metric name to a list of values, the schemas of the metrics, the URL of the Table to associate the metrics with, and any constants such as the epoch after which the metrics were collected.
If the number of samples is different from the length of the Table, provide a list of example_ids to associate each
metric value with.
The following is a simple example of performing an inference pass over a Table and collecting per-sample metrics.
import tlc
import torch

run: tlc.Run = tlc.init()
table: tlc.Table = tlc.Table.from_url(...)
model: torch.nn.Module = ...
loss_fn: Callable = ...

metrics = {"predicted_label": [],"loss": []}
for sample in table:
    outputs = model(sample)
    metrics["predicted_label"].append(torch.argmax(outputs).item())
    metrics["loss"].append(loss_fn(outputs, sample))

run.add_metrics(
    metrics,
    schema={
        "predicted_label": tlc.schemas.CategoricalLabelSchema(classes=["cat", "dog"]),
        "loss": tlc.schemas.Float32Schema(),
    },
    foreign_table_url=table.url,
    constants={"epoch": 0},
)
run.add_metrics() can also be used to log arbitrary
tabular data. If the column signature of such a table does not match that of other metrics tables, it is shown as a
separate tab of metrics when opening the Run in the Dashboard.
Aggregate Metrics
In most cases, you will want to collect aggregate metrics over the entire dataset. This lets you track the performance of your model on the entire dataset across multiple runs. There are two main ways of doing this:
Use
tlc.log()to log a single dictionary of key-value pairs to the current active Run. This is suitable for simple scalar values such as aggregate loss or accuracy. Subsequent calls totlc.log()with the same dictionary keys will extend the metrics over time.If you are using a
MetricsCollectorto collect per-sample metrics, averages of each metric are computed automatically. To disable this behavior, setcompute_aggregates=Falsewhen creating theMetricsCollector.
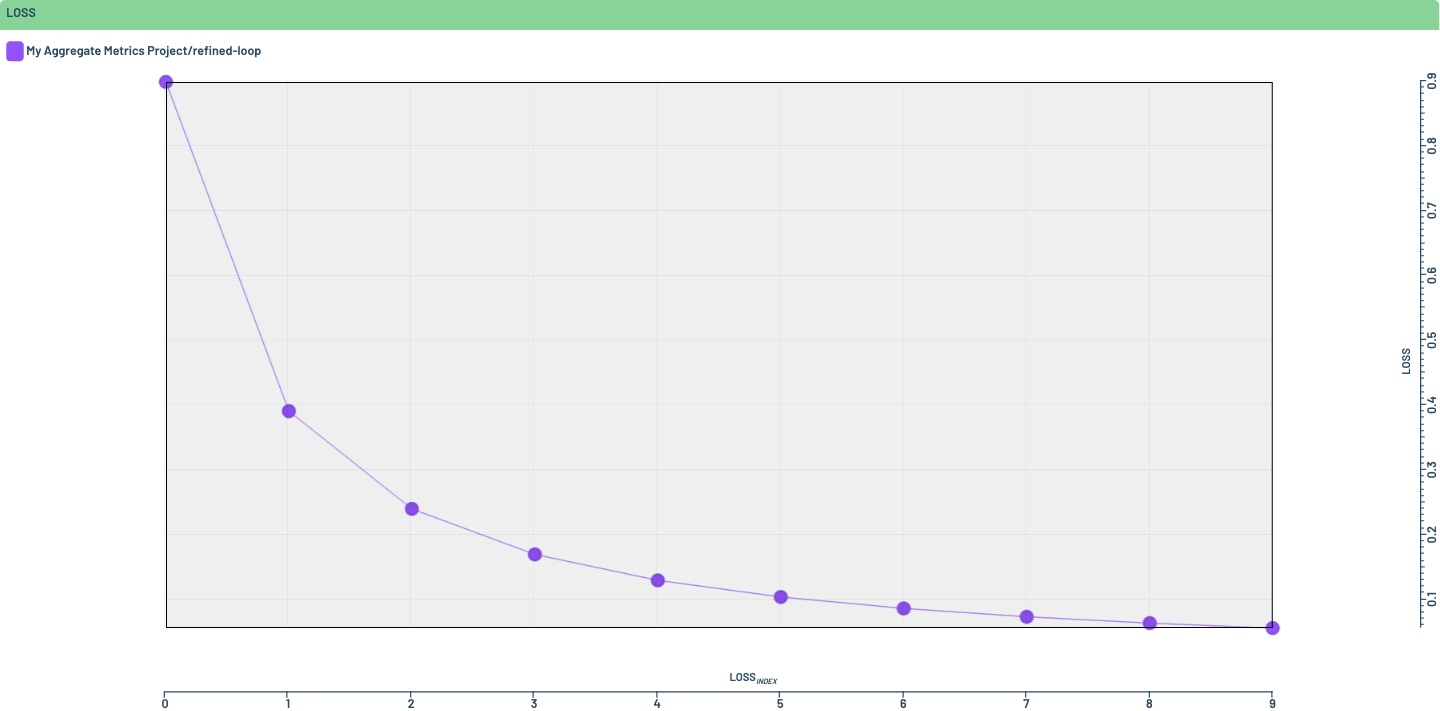
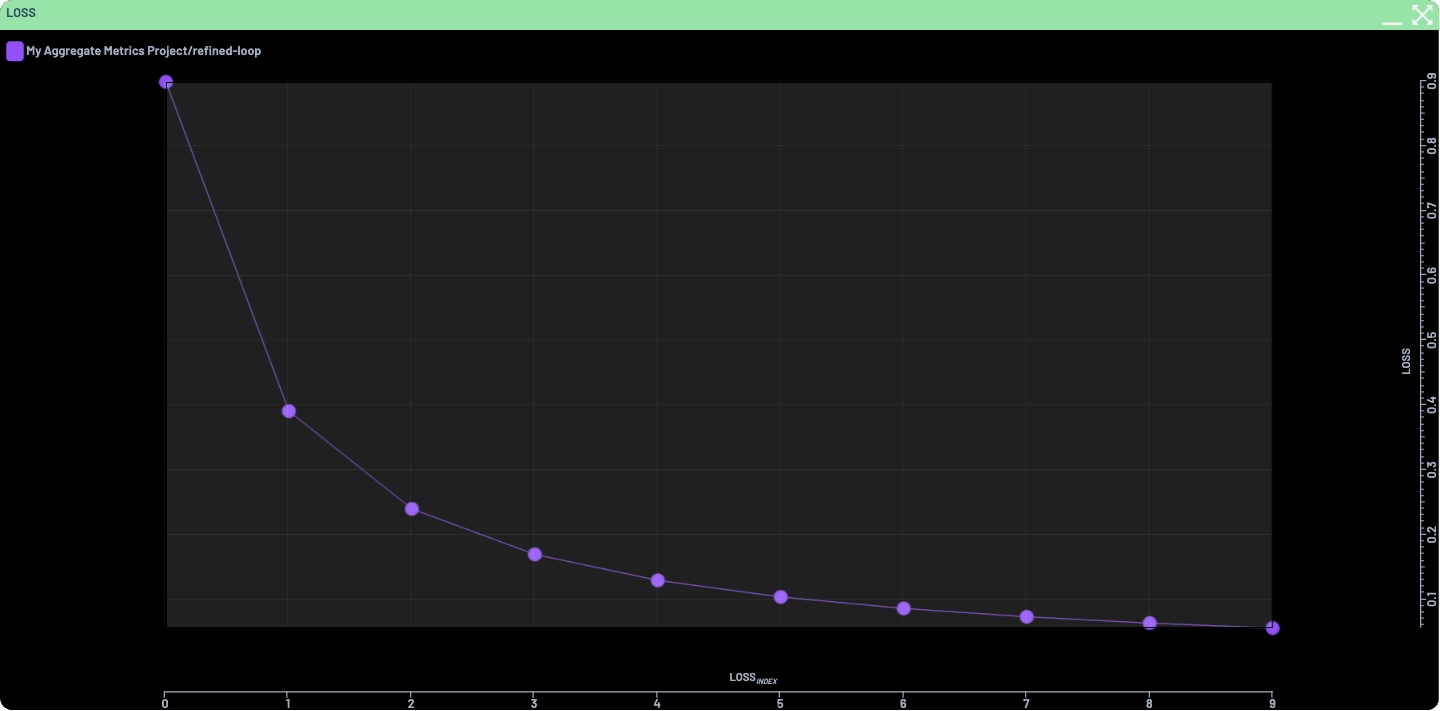
Aggregate metrics are automatically charted in the Runs overview of a Project, using an internal time axis, or one of “epoch”, “iteration”, or “step”, if present in the data. The following example logs a dummy loss curve over ten epochs
which automatically produces the following chart in the Dashboard when opening the Project
My Aggregate Metrics Project: