Bounding Boxes
BBs describe objects with an enclosing axis-aligned rectangle and typically a category.
Creating Tables
The most convenient way of making Tables with bounding box columns is one of the importers such as
tlc.Table.from_coco() or
tlc.Table.from_yolo_url(), as these populate the data and define
a schema for the bounding box column.
In Python when using 3LC, BB data is represented as a dictionary with a list of instances, often something like:
{
    "image_width": 640,
    "image_height": 480,
    "bb_list": [
        {"label": 0, "x0": 0.0, "y0": 0.0, "x1": 320, "y1": 240},
    ]
}
The structure of the column with Bounding Boxes is defined by its Schema. The
BoundingBoxListSchema class is
used to define the schema of a column with 2D bounding boxes. This class allows you to define the roles and units of
each coordinate, enabling representing different bounding box formats such as YOLO and COCO.
Create BB Tables from YOLO Format: Build Tables from YOLO datasets
Create BB Tables from COCO Format: Build Tables from COCO datasets
Create Custom BB Tables: Create BB Tables programmatically
Framework Integration
To use BBs in your model training, you can use the following frameworks and approaches:
Ultralytics YOLO: Full integration for training and validating detection models with
Tables with a BBs columnDetectron2: Full integration for training and validating detection models with
Tables with a BBs columnCustom PyTorch Models: Use direct
Tableaccess in your training loops
Visualization
Create a BB and Image chart
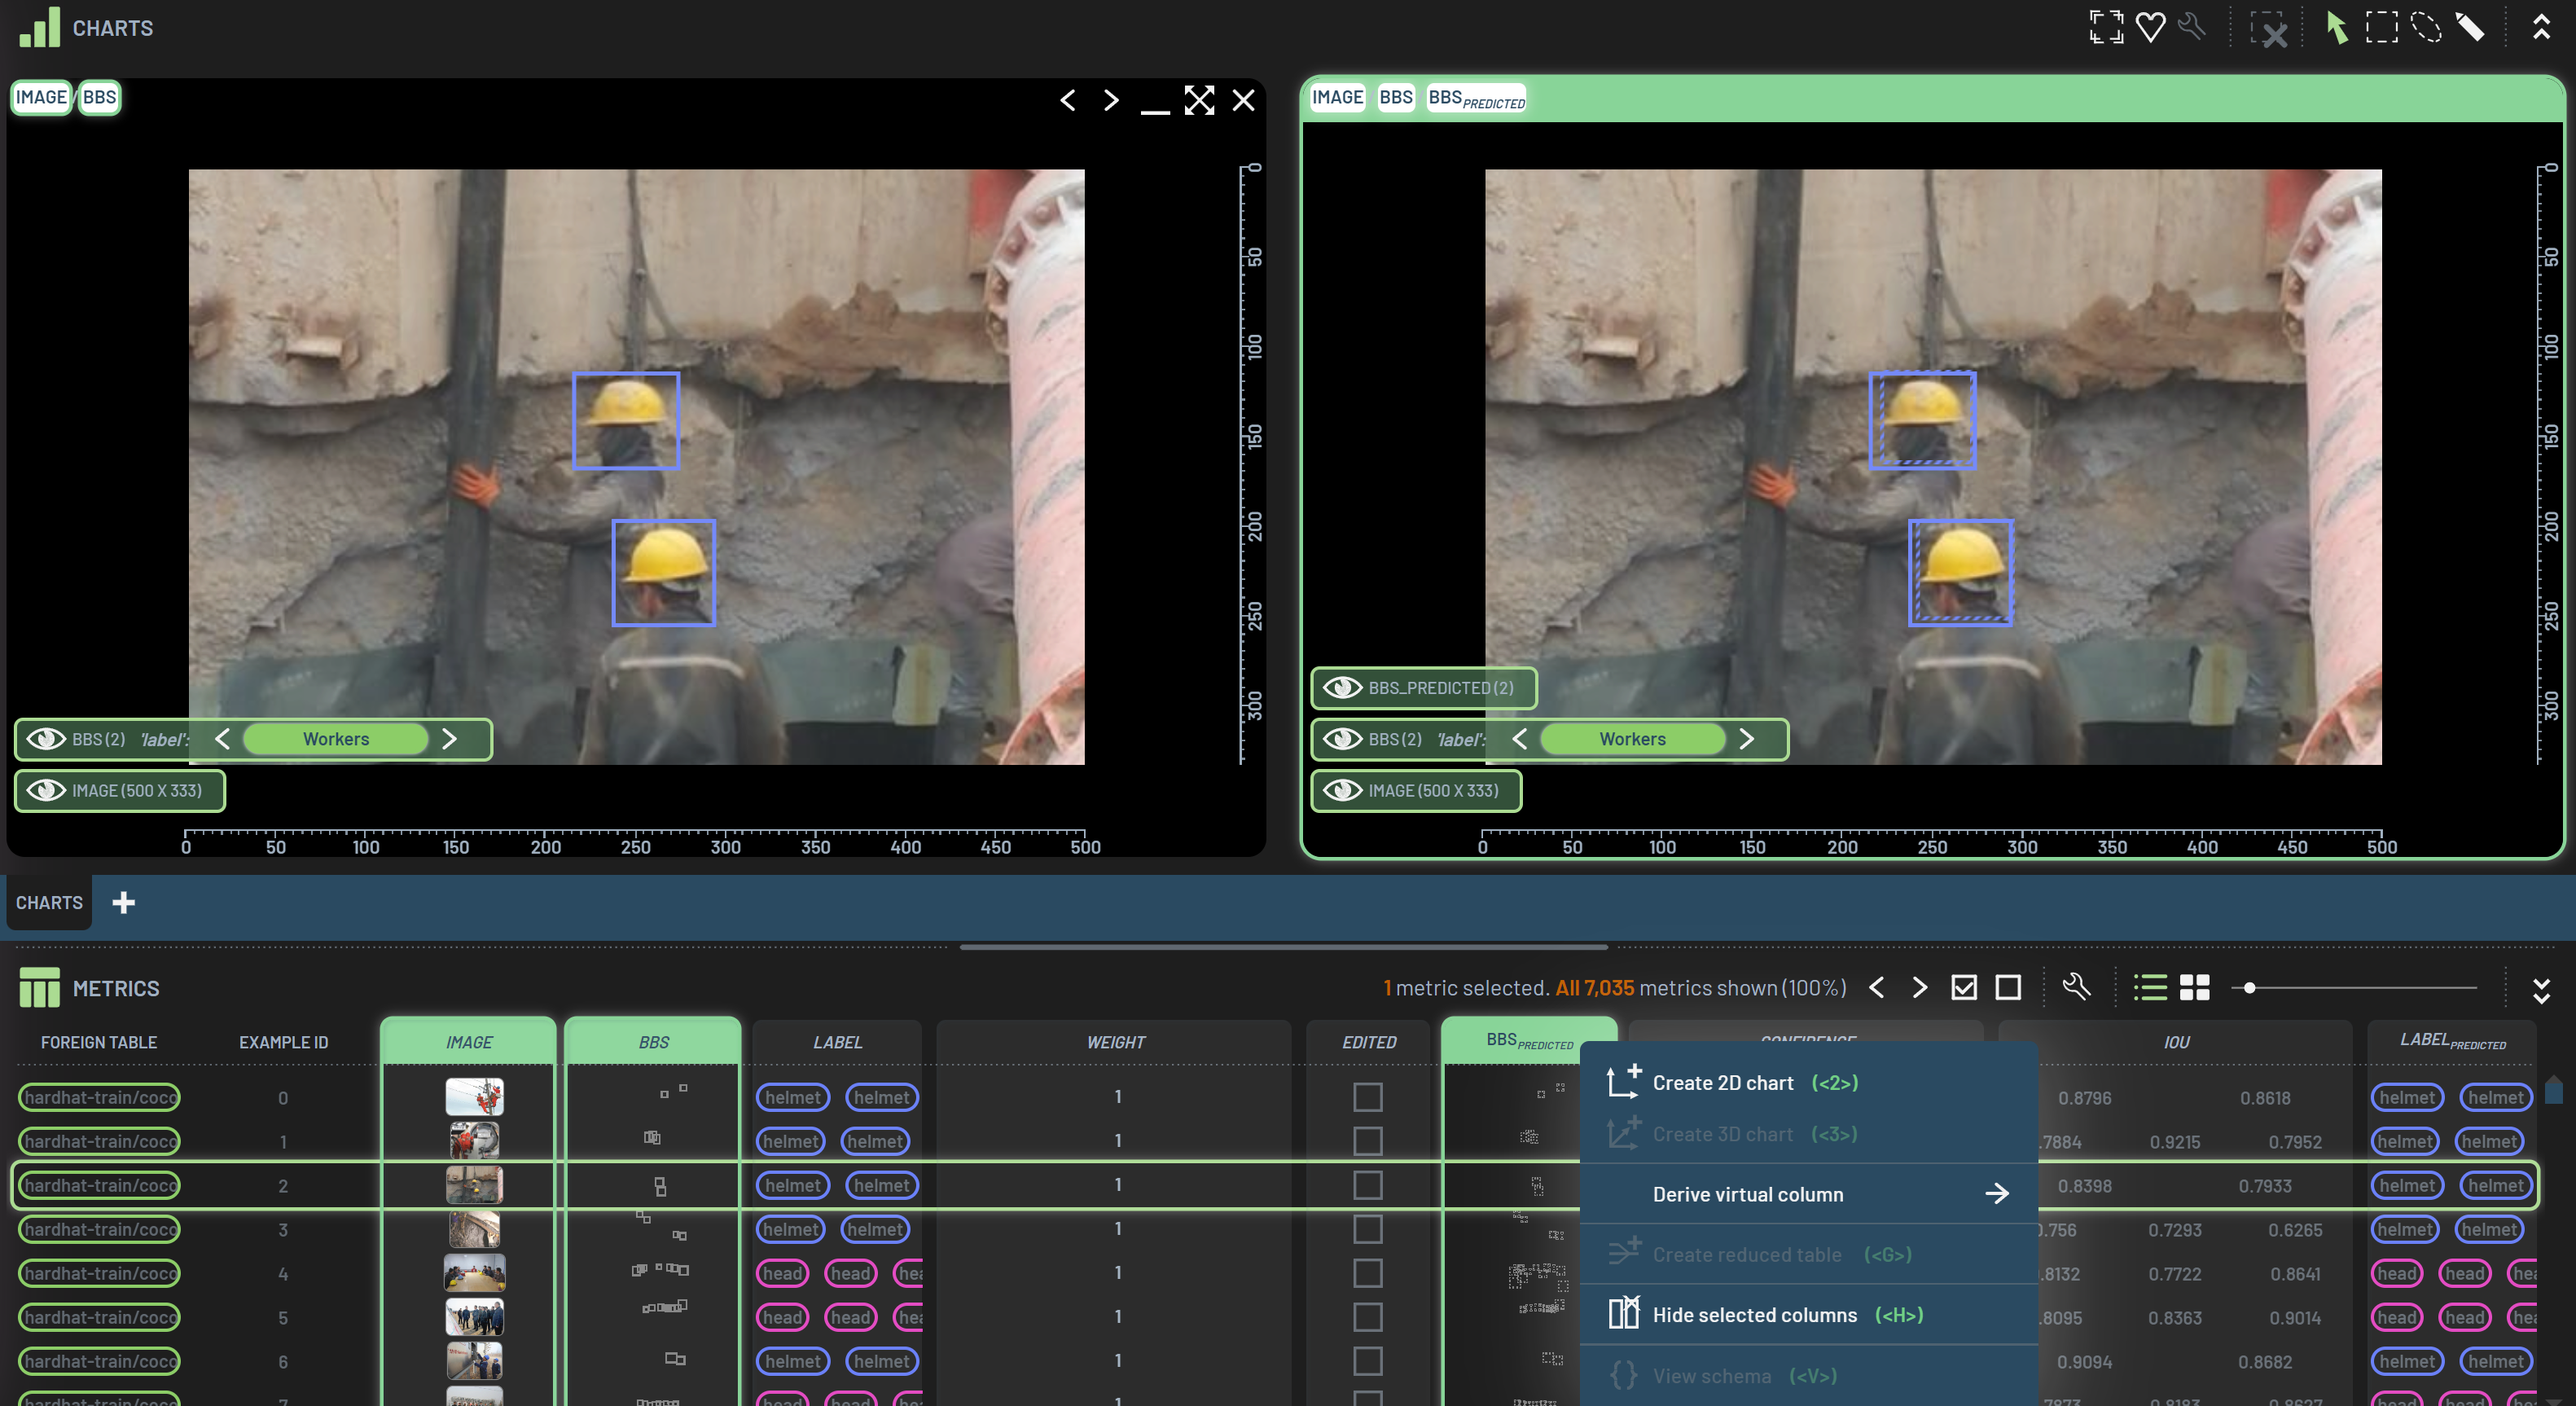
The difference between creating an image chart and creating a BB-image overlay chart is to select both the image and BBs columns and create a 2D chart by pressing 2. To overlay both ground truth BBs and predicted BBs, you just need to select the three columns image, BBs and BBspredicted and create a 2D chart. You can plot the BBs by only selecting the BBs or BBspredicted column. In the Dashboard, solid rectangle outlines represent ground truth BBs while dashed rectangle outlines represent predicted BBs.
Navigate BBs
To navigate BBs, select one BB and click the < or > icon on the chart’s title bar (or press
Left or Right arrow key) to navigate to previous or next BB. Note that the
ground truth and predicted BBs are navigated independently. In other words, when navigating through the ground truth
BBs, the predicted BBs will not be visited, and vice versa, even if they are plotted on the same chart.
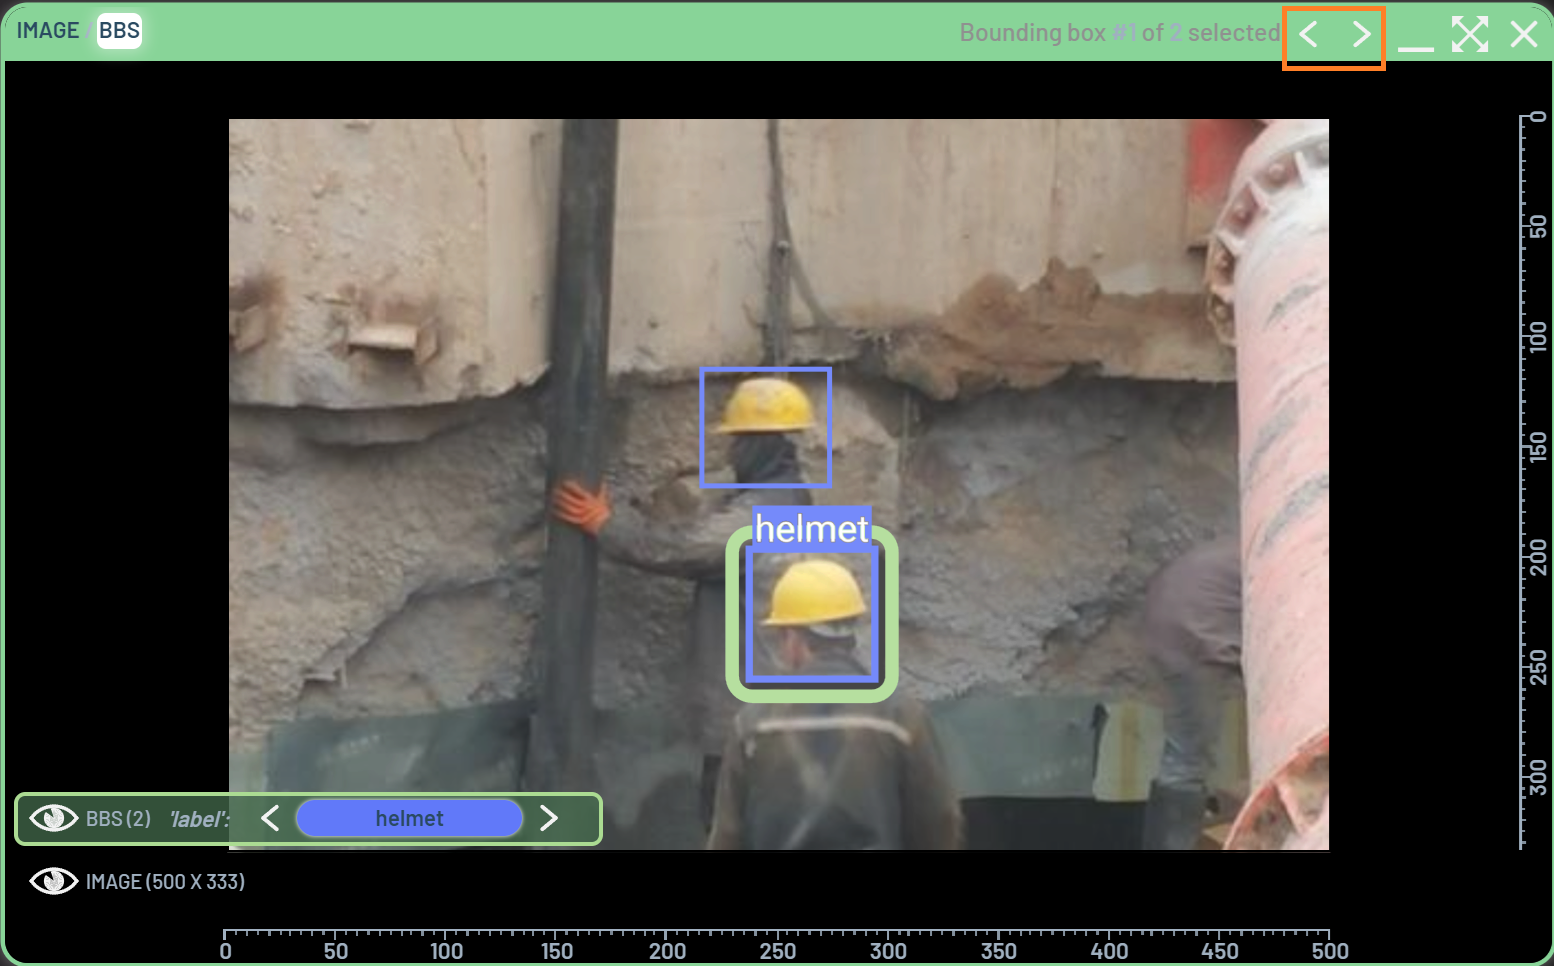
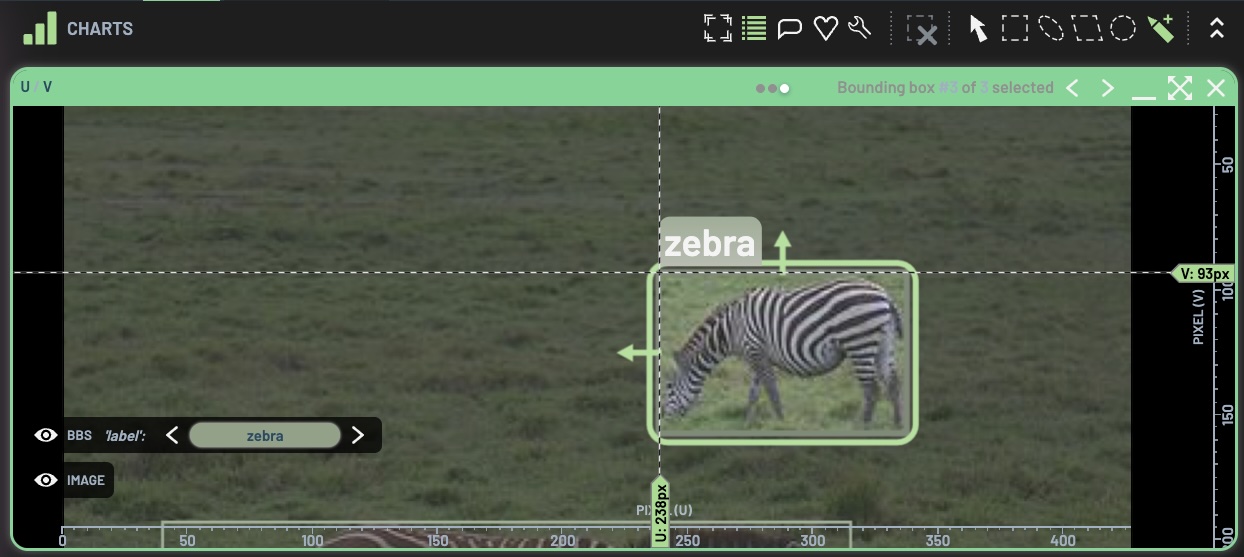
Navigating to a new BB will by default snap the view to that BB as shown below.

There are three options, immediate, smooth, and off, when it comes to
Snap to next/previous bounding box or image layer in the global settings dialog. If you
don’t want to snap to the next/previous BB, select off for it.
To snap to a specific BB, you can DoubleClick on the BB, when the option of
Snap to double-clicked bounding box or image layer is on immediate or smooth.
To select multiple BBs, you can do one of the three ways:
CTRL + click on BBs
Use a polygon selection tool to select BBs
CTRL + A to select all BBs on the chart
Note: when using a polygon selection tool, the BBs will be selected as long as the BBs are partially inside the polygon.
You can also adjust the Snap-to-box margin setting to choose the zoom-in level when the BB is snapped to.
In addition, you can change the BB settings about the outline style and mask opacity under the
BOUNDING BOX EDITING section. The outline style refers to the outline around the BB when it is selected, and the
default color is green. The mask opacity refers to the opacity outside of the selected BB(s). The example below shows
the effect with default outline style and 0.5 for mask opacity.

How to use BB-based filters
BB-based filters are those BB’s properties such as BB’s label, confidence, and IoU, etc. They apply to individual BBs, whereas sample-based filters apply to individual rows in the metrics/examples table. When using BB-based filters, the rows will not be filtered out until all of the ground truth BBs or predicted BBs are filtered out for those rows.
In the figure above, three BB-based filters, Confidence, IOU, and
Labelpredicted are applied. There are three orange boxes highlighting some numbers. In the Filters
panel, (178/6,368) next to the Label head represents the numbers of filtered-in/total predicted BBs with the head
label. In the chart, (1/3) represents the numbers of filtered-in/total predicted BBs on this image. In the Metrics
panel, 123 is the number of filtered-in rows (samples) after applying these three filters.
Since no filters are applied to the ground truth BBs, all ground truth BBs are displayed on the images.
What do the numbers represent in filters?
For sample-based filters, such as Foreign Table, the numbers represent filtered-in/total rows if any filters are applied, or simply total rows if no filters are applied.
For BB-based filters, such as Label, the numbers represent filtered-in/total BBs if any filters are applied, or simply total BBs if no filters are applied.
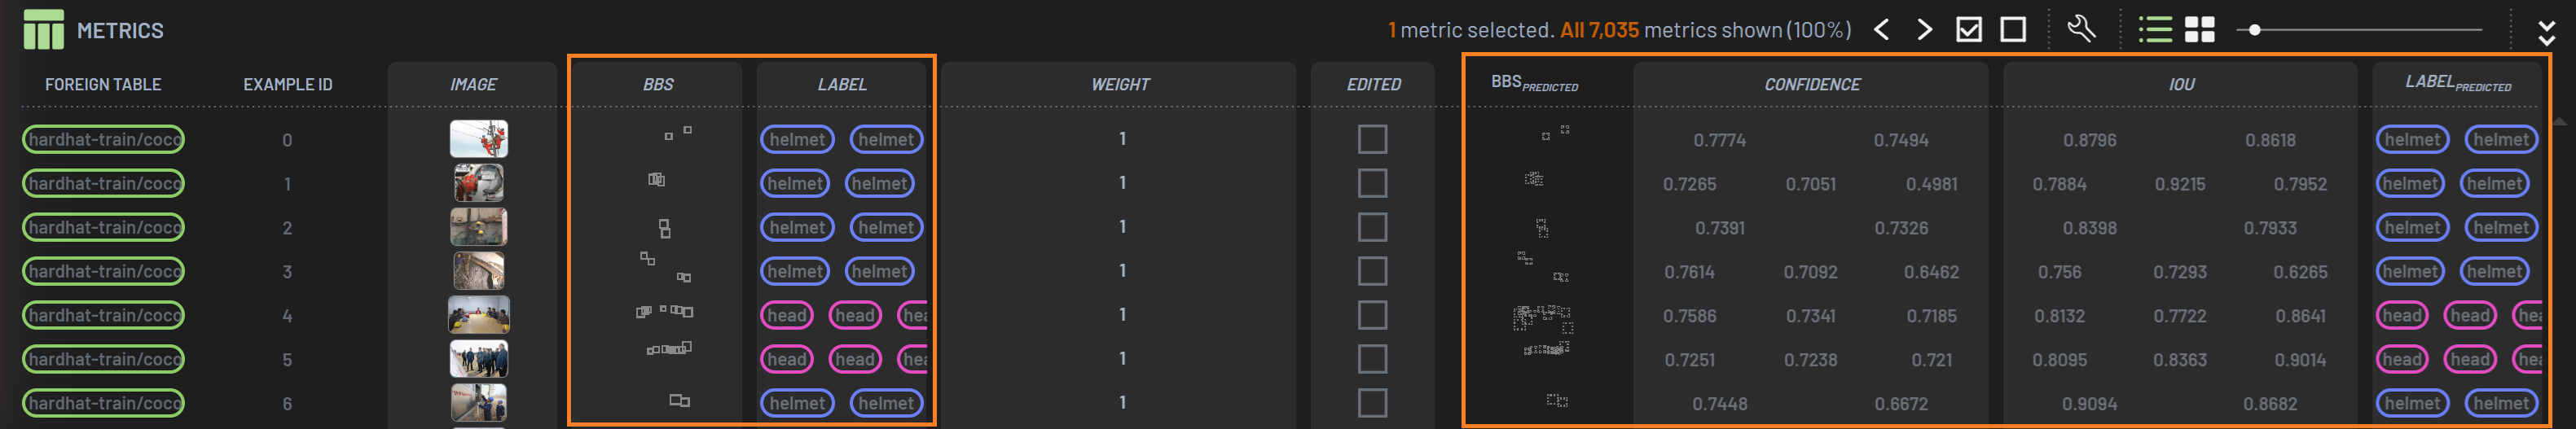
How to set BB display properties
BBs and BB’s property columns, such as BB’s label and confidence, often have multiple values in a row because multiple BBs can be on a given image. In the Metrics/Examples panel, those columns typically only display the first 2-3 values due to the limited width of the columns. However, the number of values or arrays in those columns matches the number of BBs in that row. If you copy and paste the cell values, you will be able to see all the values in those cells. In the figure below, the columns highlighted by orange boxes are this type of columns with multiple values.

On a BB chart, only the bounding box rectangles for the BBs are shown by default, but you can customize what properties
you want to display around the boxes when selected or not selected. When a chart is created with BBs and
BBspredicted, corresponding column names are shown on the lower left corner of the chart. You can
click on the eye icons next to the column names to display or hide them independently on the chart.
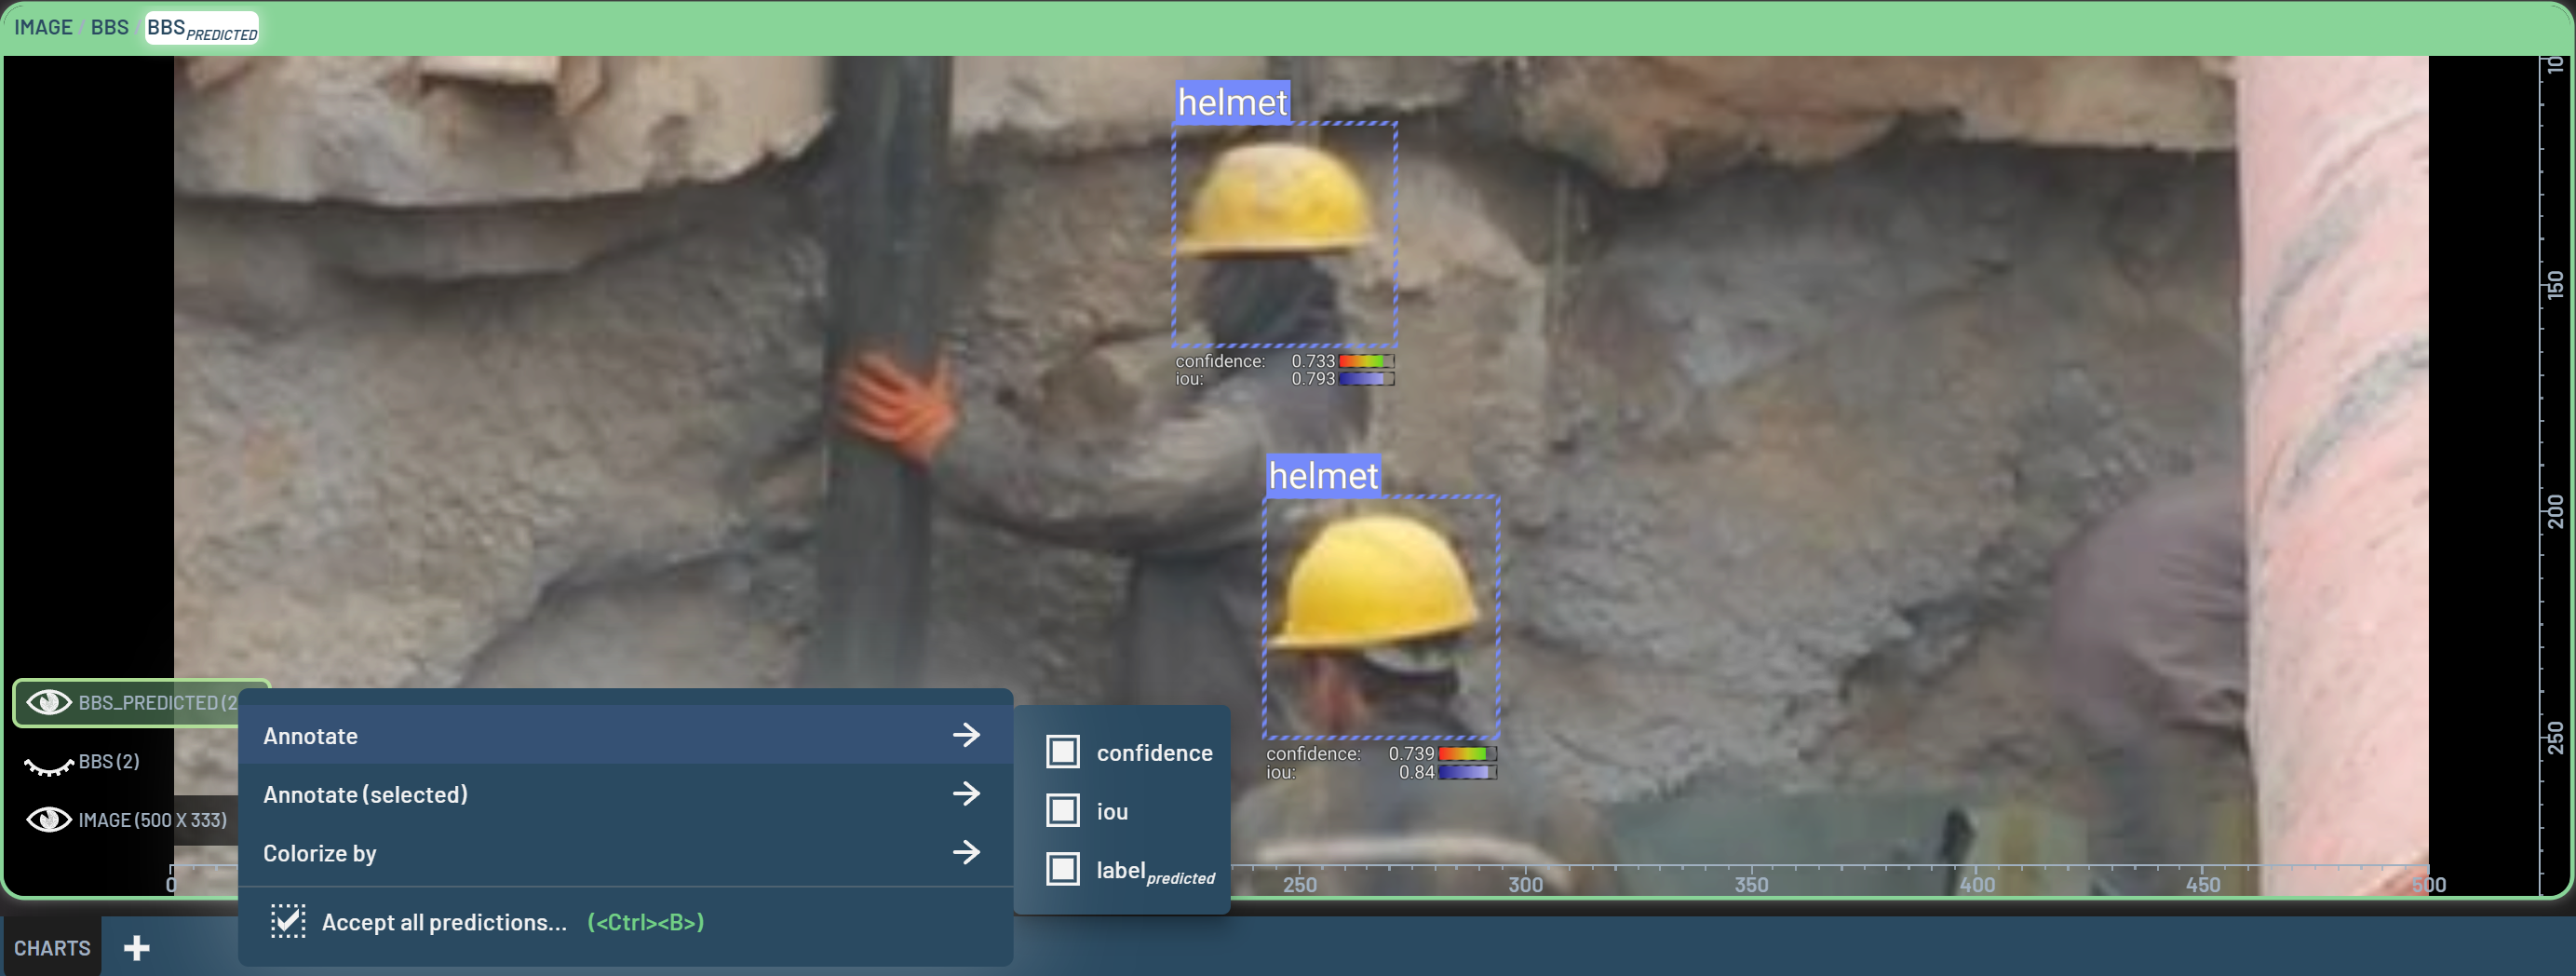
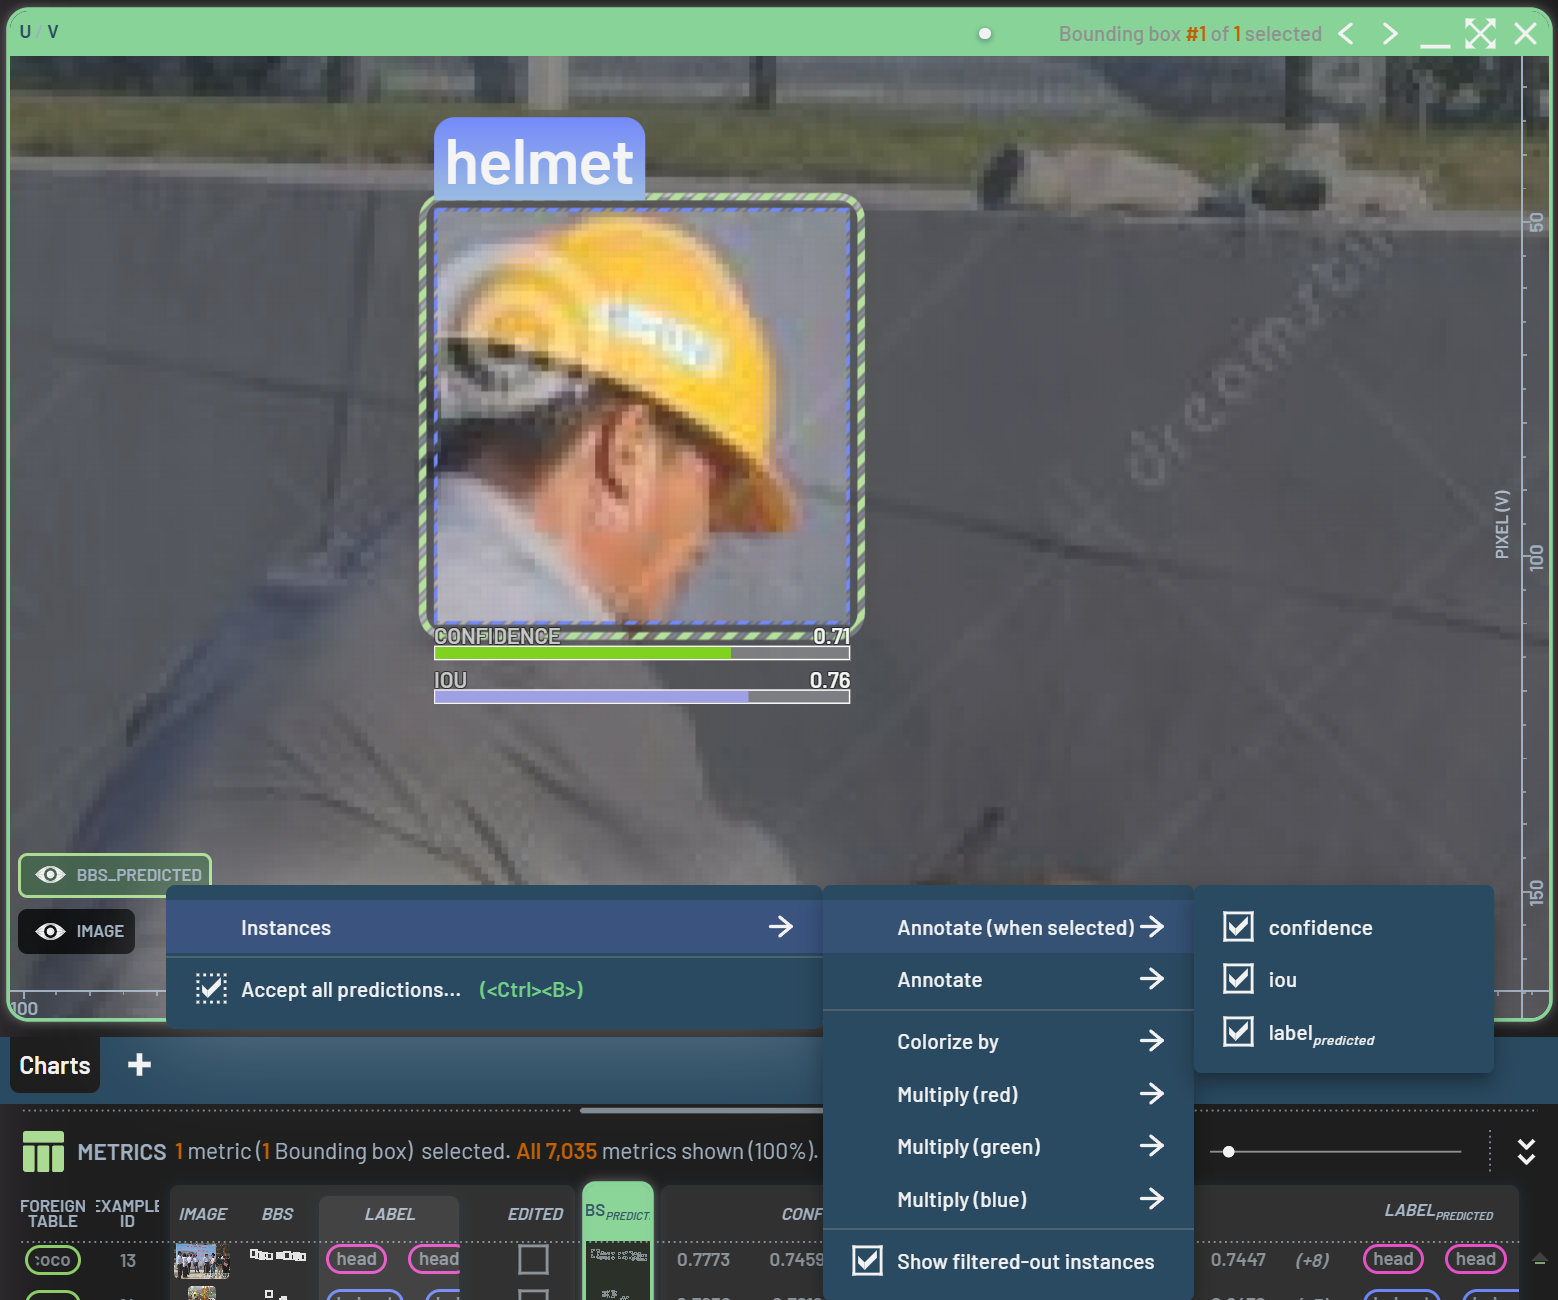
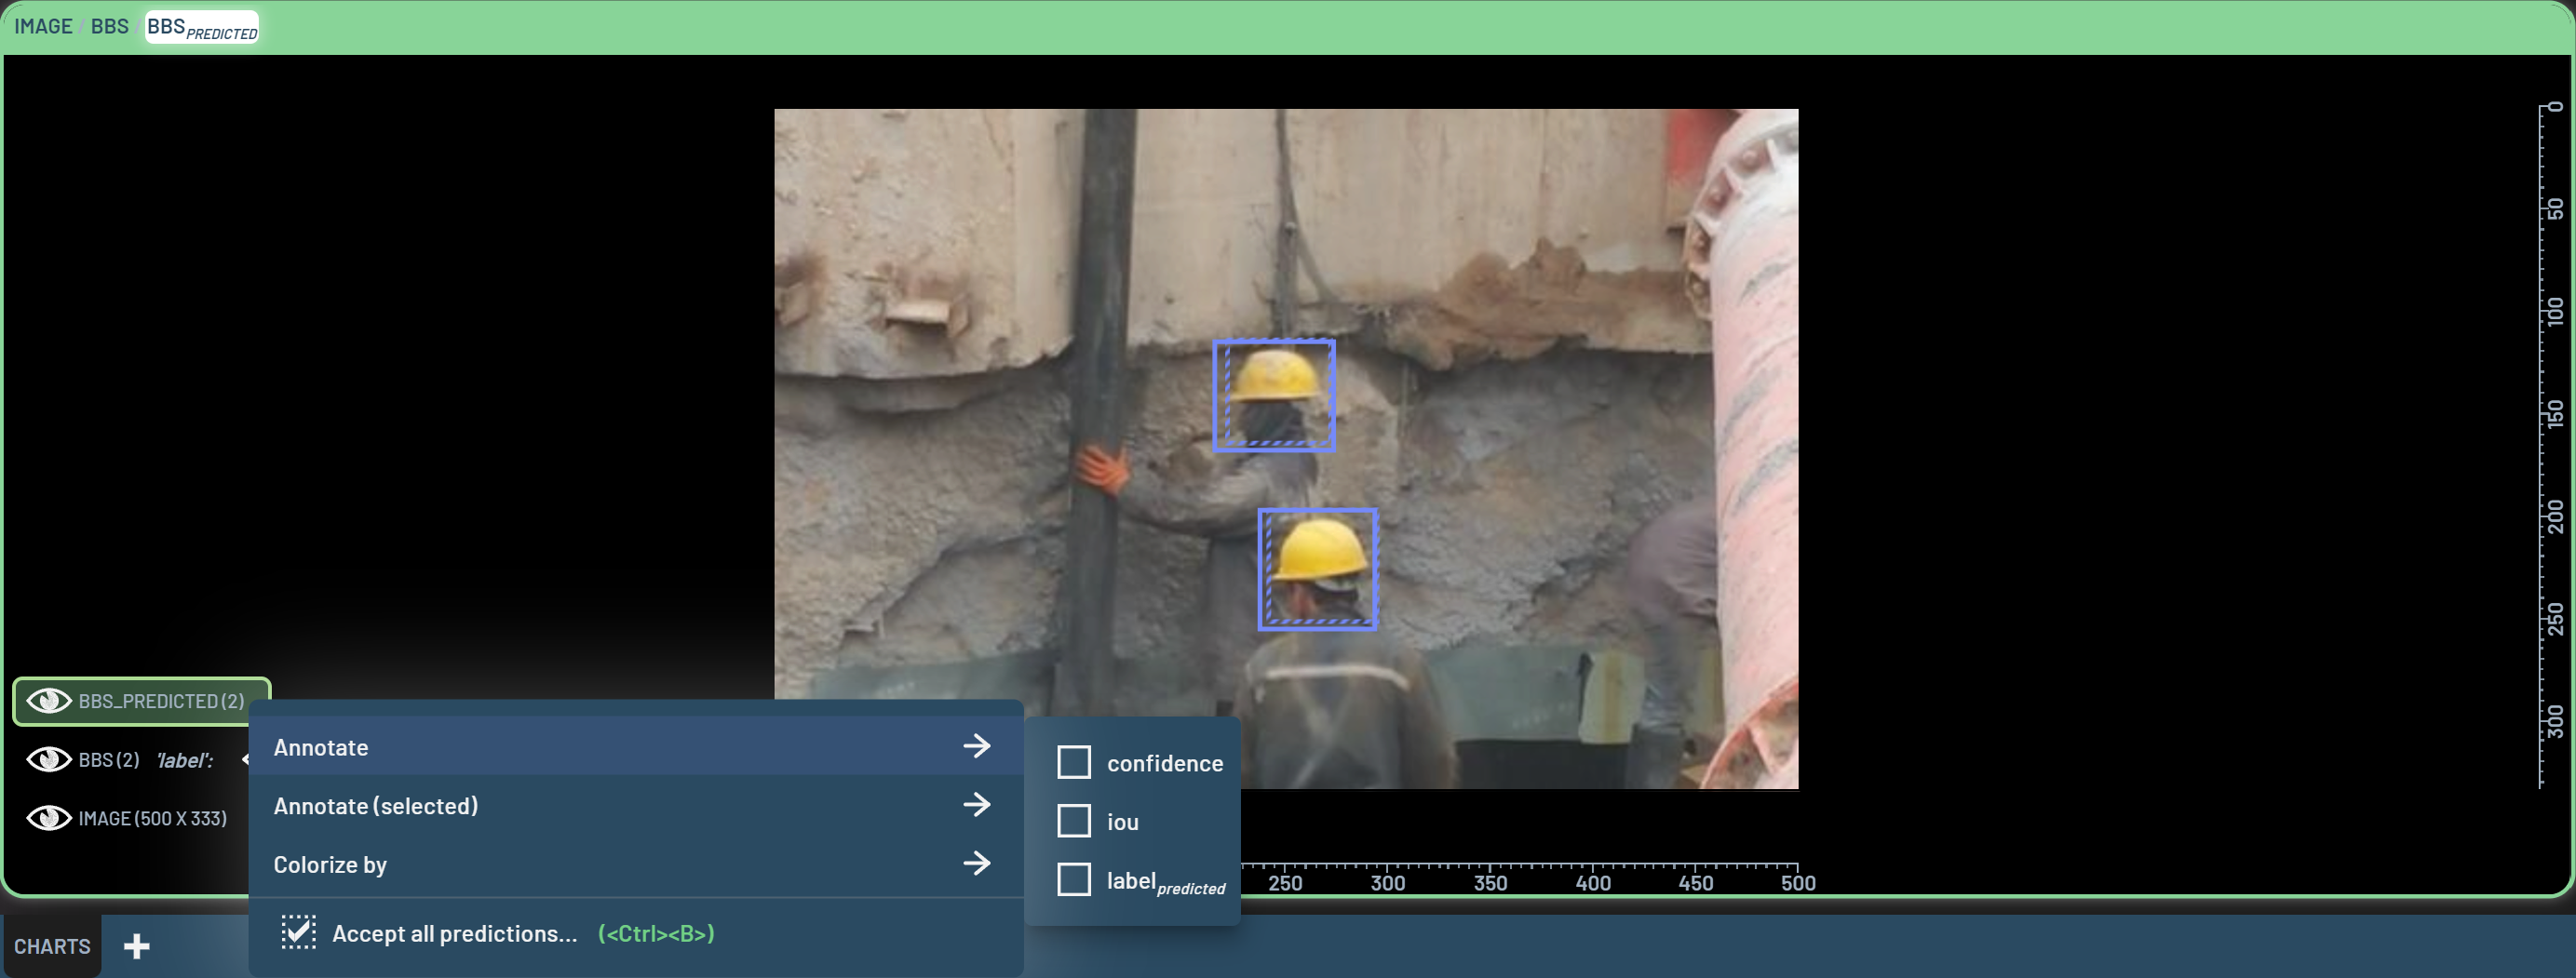
RightClick on BBS or BBS_PREDICTED to bring up the menu where you can customize the properties
to display.
The display options under Instances in the menu include:
Annotate(selected): The checked properties will be displayed for the selected BBs. Default: all checked
Annotate: The checked properties will be displayed permanently for all BBs. Default: all unchecked
Colorize by: The BBs are colorized by the selected property. Default: label
Multiply(red): The value of color’s red channel is multiplied by the property you select. Default: all unchecked
Multiply(green): The value of color’s green channel is multiplied by the property you select. Default: all unchecked
Multiply(blue): The value of color’s blue channel is multiplied by the property you select. Default: all unchecked
Here is an example of all properties being checked under Annotate (when selected) and shown on the selected BB. For
numerical properties such as confidence, a color bar next to the value shows where this value is at in the range of
all data. Note that all available properties for corresponding BBs (i.e., ground truth or predicted) will be displayed
under each drop-down menu. The available properties depend on what metrics you have collected and which
virtual columns you have derived. Therefore, the properties that you see in your project may not
be exactly the same as the example shown here.
Editing
Create and edit BBs
To create or edit BBs, a BB chart with the ground truth BBs needs to be created. Once the BB chart is created, select the pen icon on the far right of the Charts title bar, and then you can start to create a new BB by clicking and dragging in the chart.
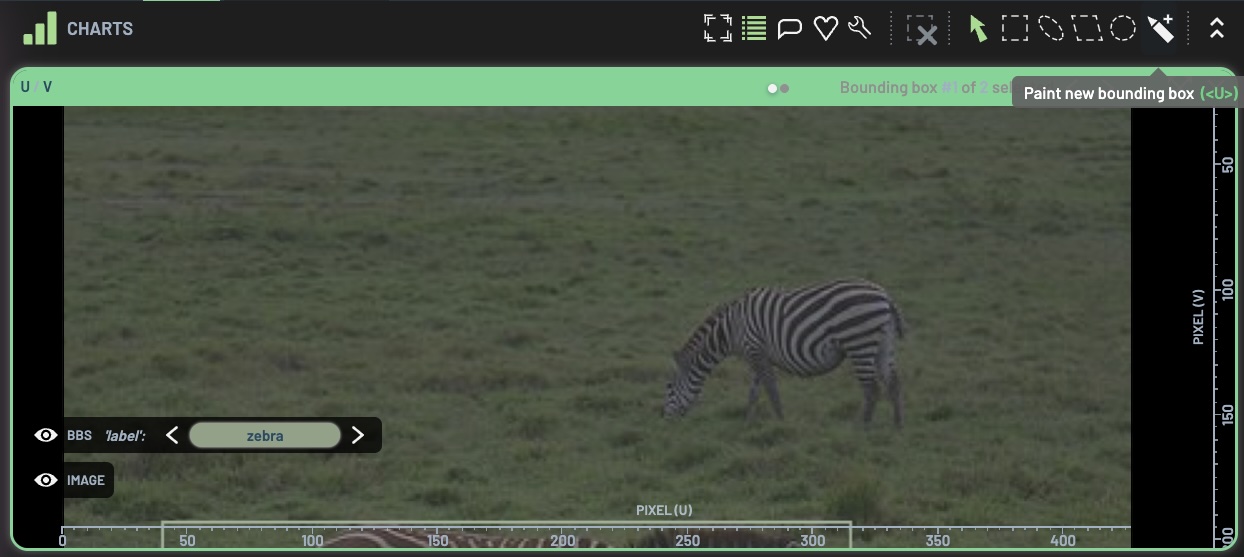
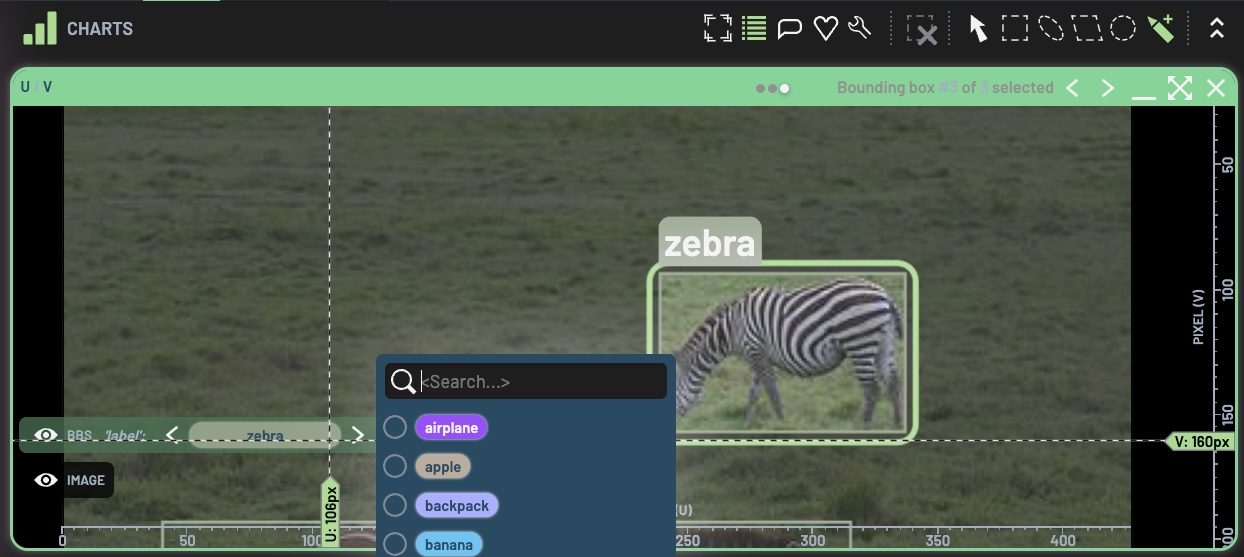
The newly created BB is assigned to be the current active label displayed on the BBS 'label' menu on the lower left
corner of the chart. If you want to change the BB to another label, click the label there and select a label in the
dropdown menu as shown below, or press the keyboard shortcuts K or L to go
to the previous or next label until the desired one is reached. Note that, to change the label for a BB, the BB must be
selected.
If you are in the pan/select mode (i.e., the arrow pointer), you can create a BB by Ctrl + RightDrag.
To edit a BB, click and drag an edge or a corner of the BB when in pan/select mode.
To delete a BB, there are three options:
RightClick on the BB, and then click
Delete bounding boxon the popup menuSelect the BB, press Delete or Backspace
Ctrl + Shift + click the BB.
Create a new class
Creating a new class in the Dashboard is useful when you want to train your dataset with additional classes.
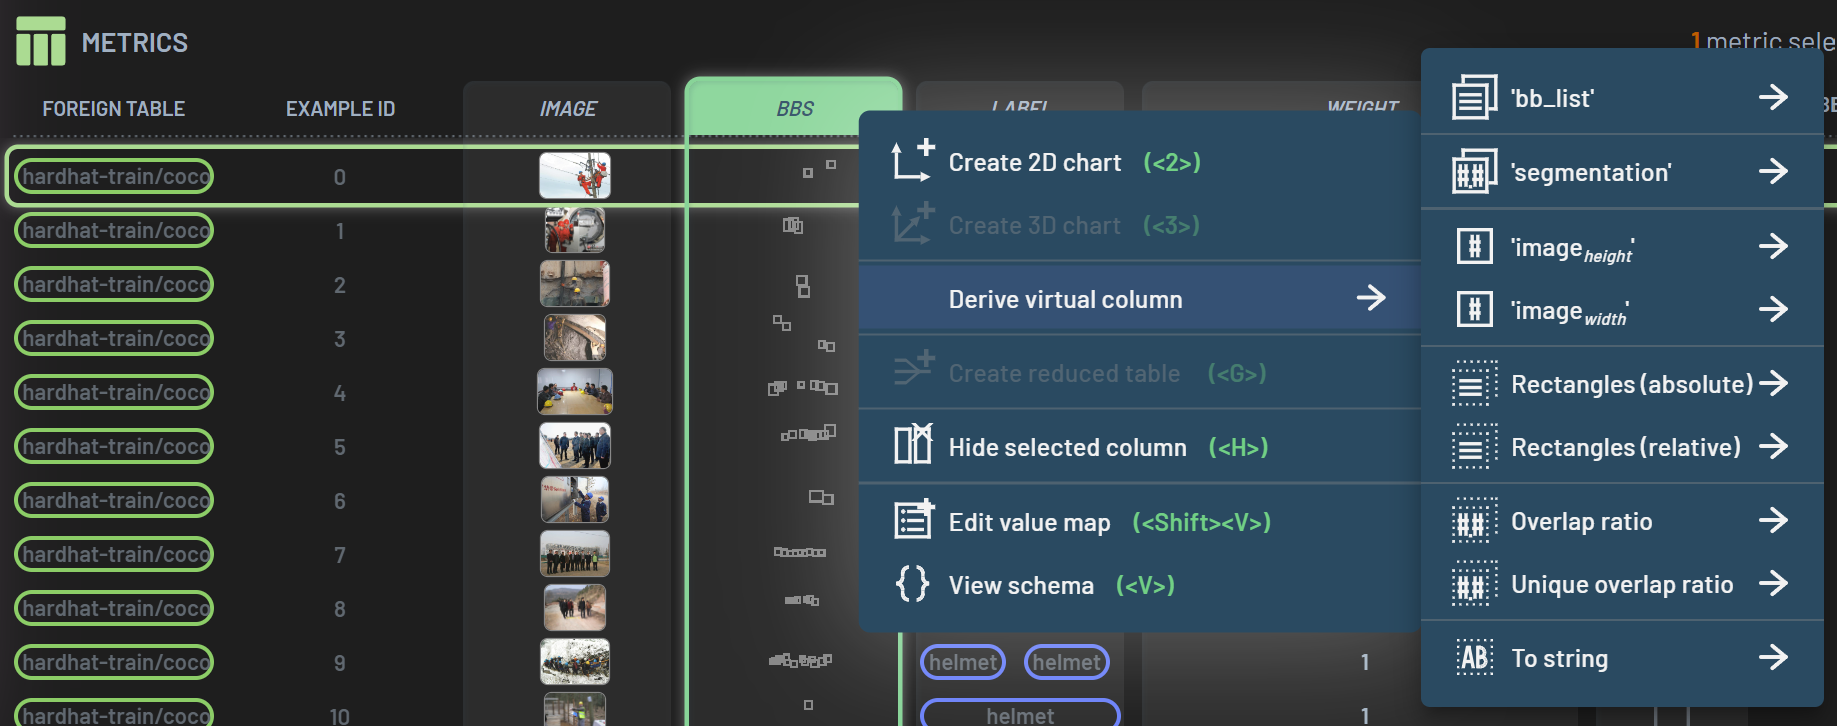
To create a new class, select the BBs column, RightClick on the column header, and
then select Edit value map from the popup menu. Note: select the Label column in classification
projects for the first step.

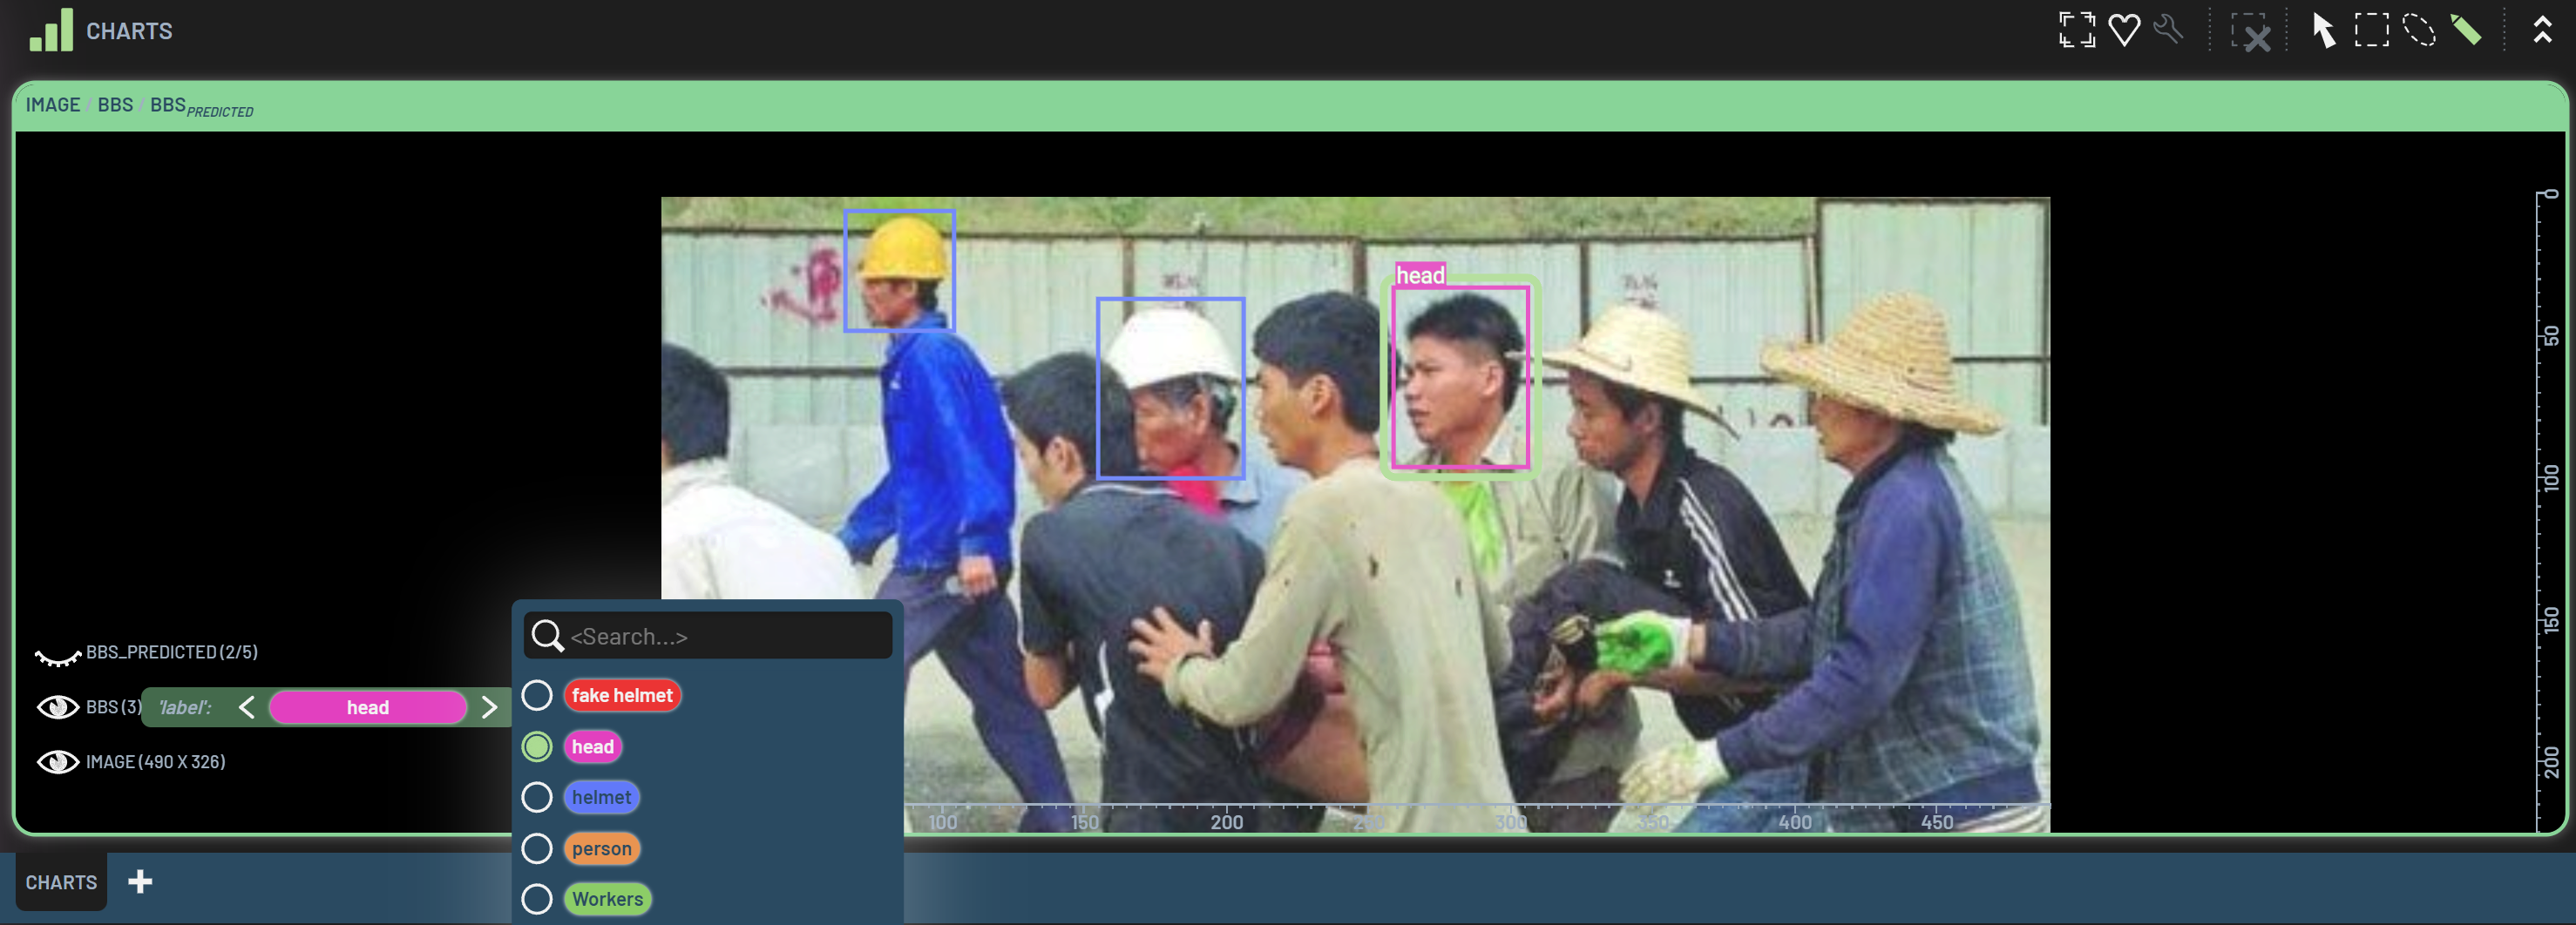
Inside the value map dialog that shows up, you can add new classes at the bottom of the existing class list.
The Internal name is required, and the other fields are optional. You might want to specify a desired color with a
color hex code. Otherwise, a color will be automatically assigned for the new class. Click the check mark at the far
right to complete the addition of the class. In the figure below, the fake helmet is a newly added class for
demonstration.
To save the new class into your dataset Tables, you must commit the edits into a new revision.
Convert predictions to ground truths
In the Dashboard, you are not only able to manually create and edit BBs, but also you can convert predicted BBs to ground truth. It can be done on individual BBs, on a sample, or on all samples.
Converting a predicted BB
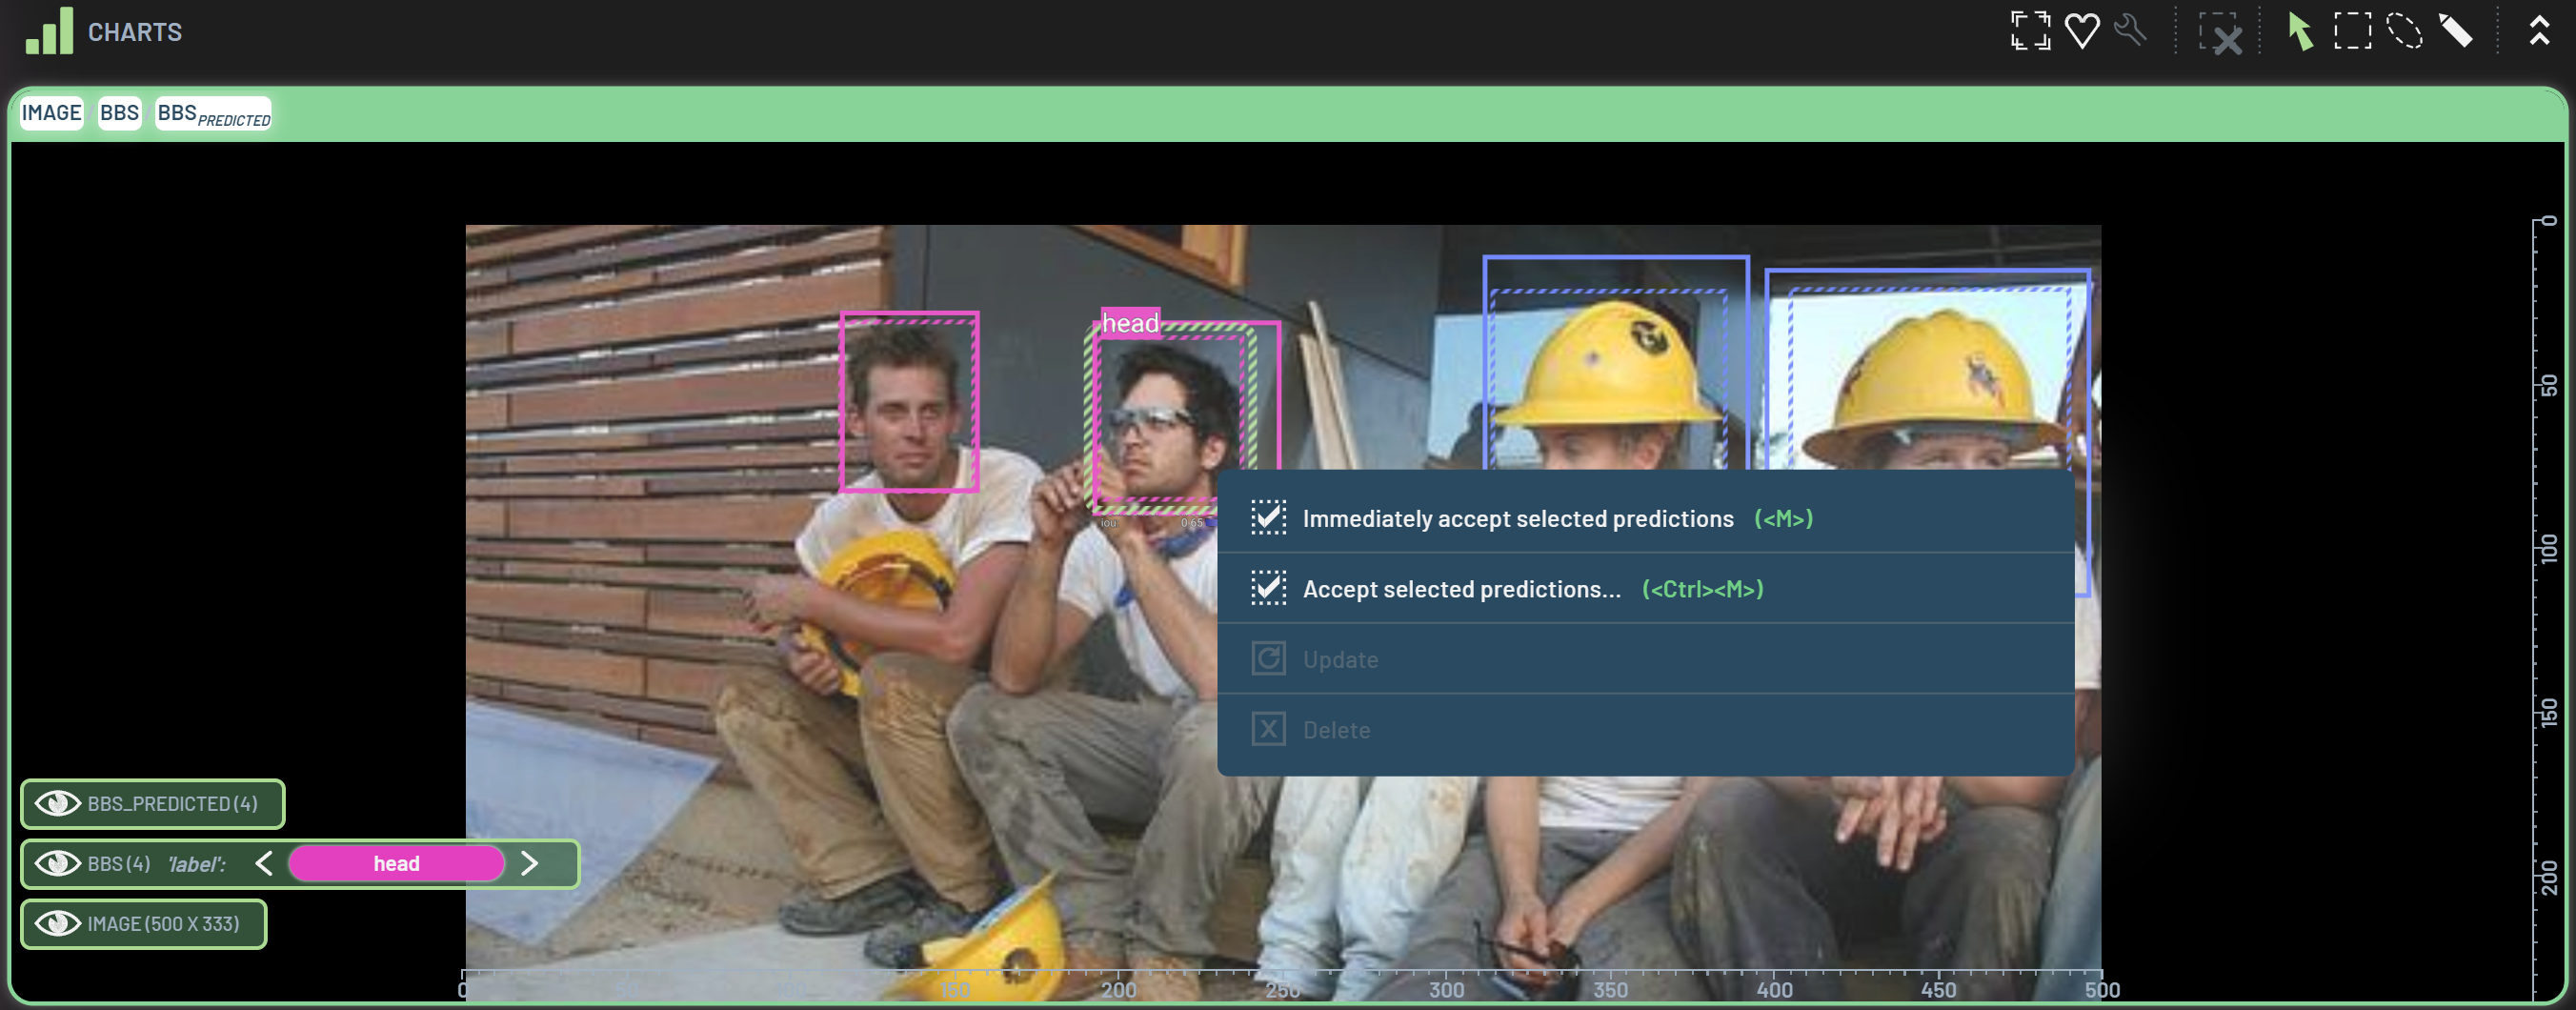
To convert a predicted BB, select the BB and RightClick it on a chart with predicted BBs. In the
popup menu, you can select either Immediately accept selected predictions or Accept selected predictions. The
difference between the two options is that the former is to directly convert the selected BB to the ground truth while
the latter will bring up the Accept predicted bounding boxes dialog, where you can customize all the criteria for
converting. The keyboard shortcuts for the two options are M and
Ctrl+M, respectively.
‘Accept predicted bounding boxes’ dialog
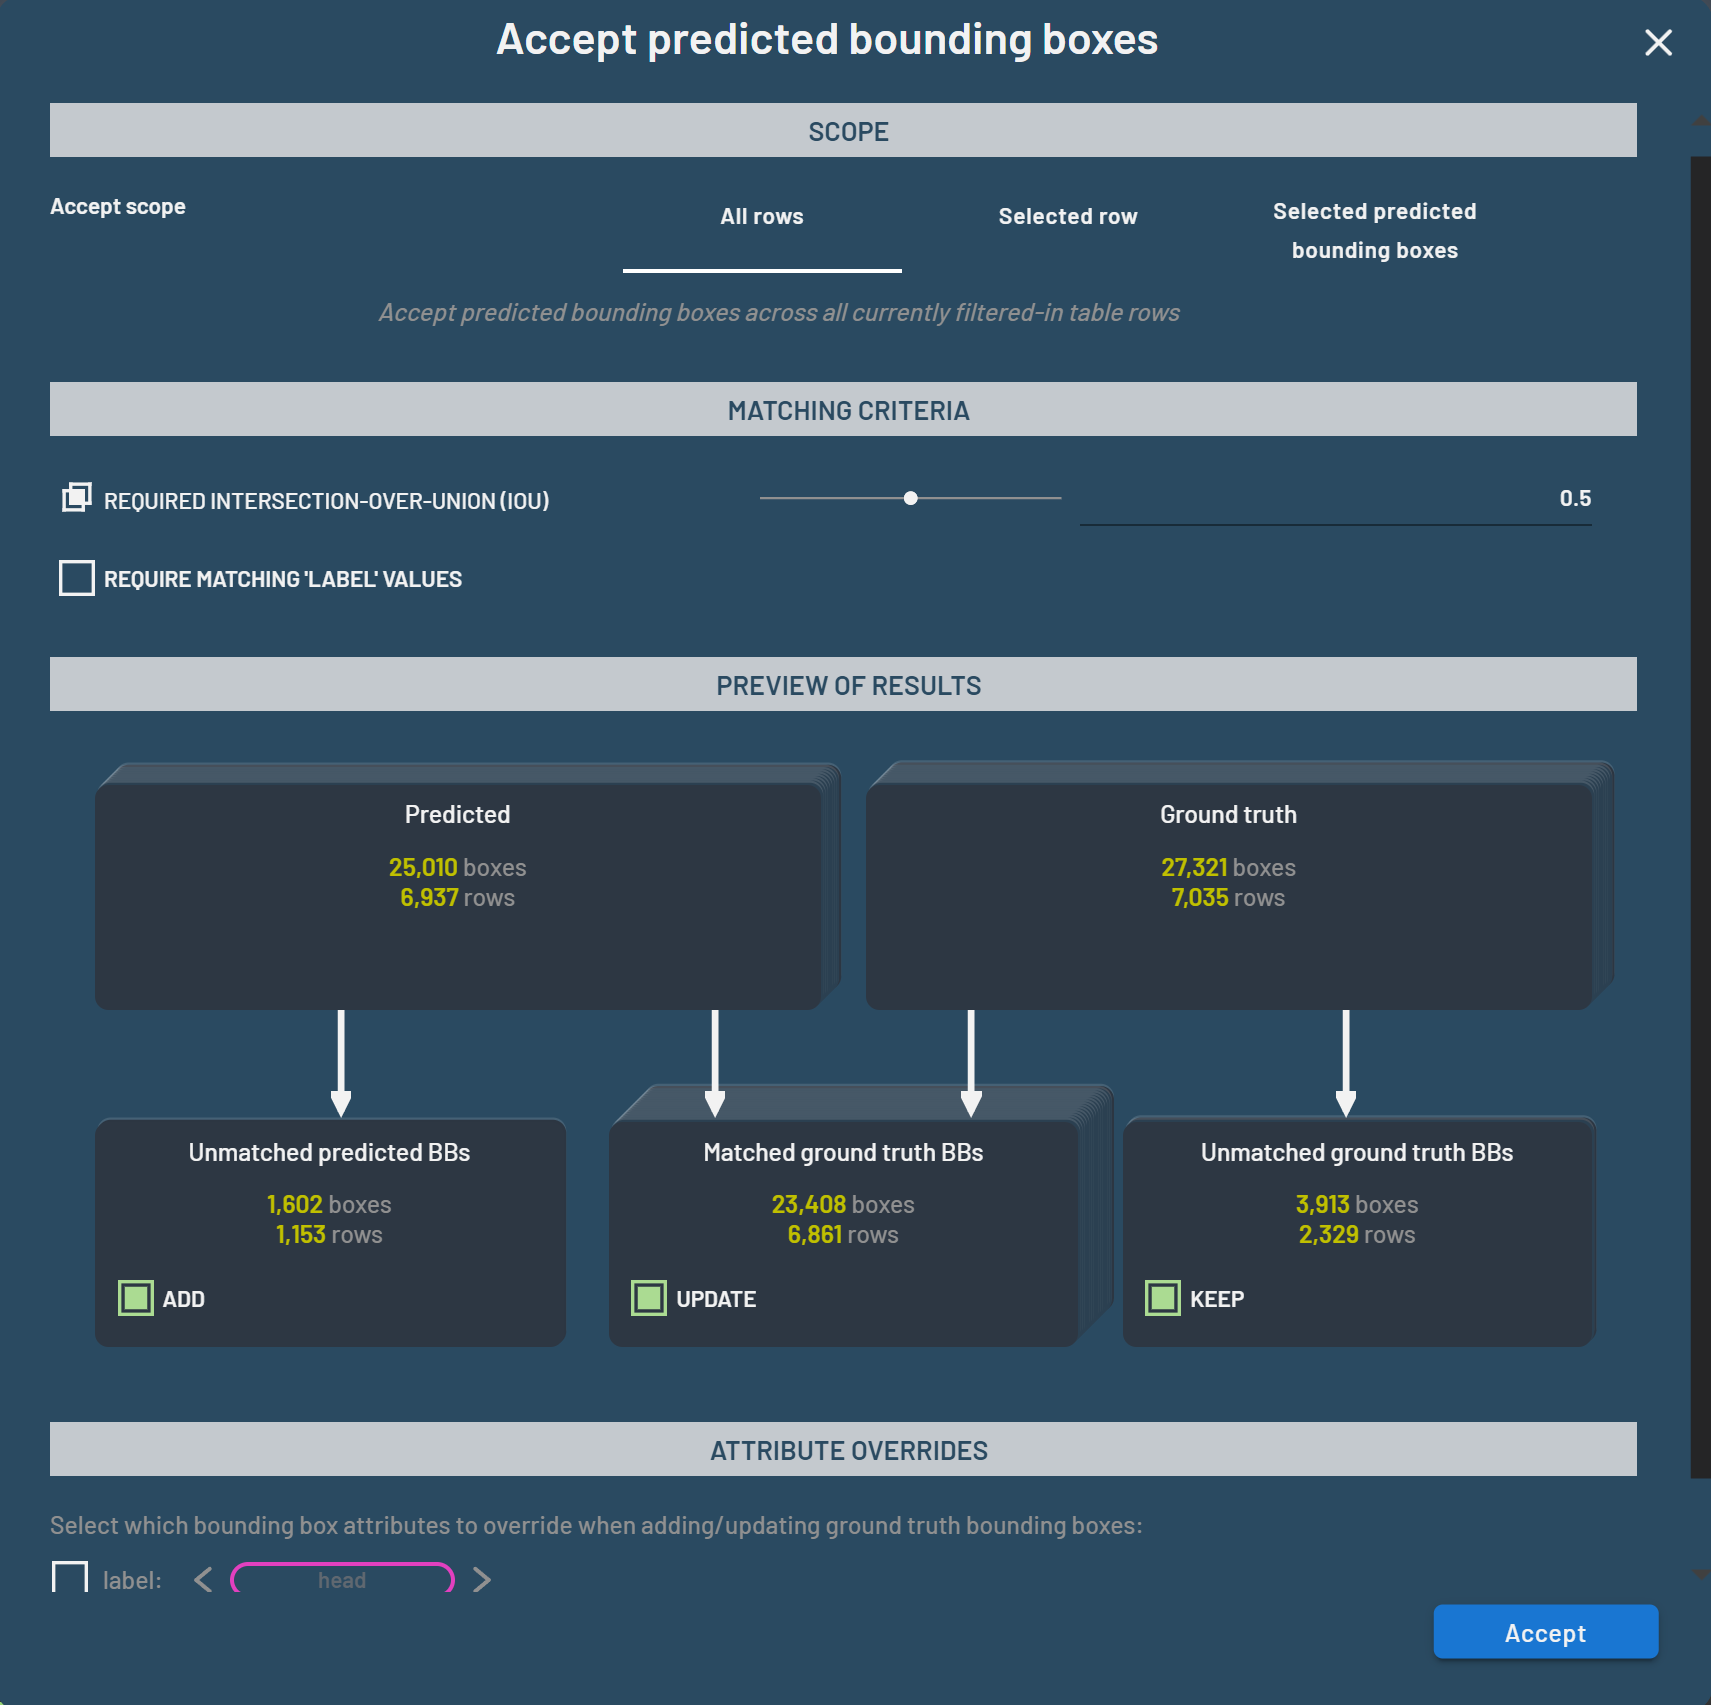
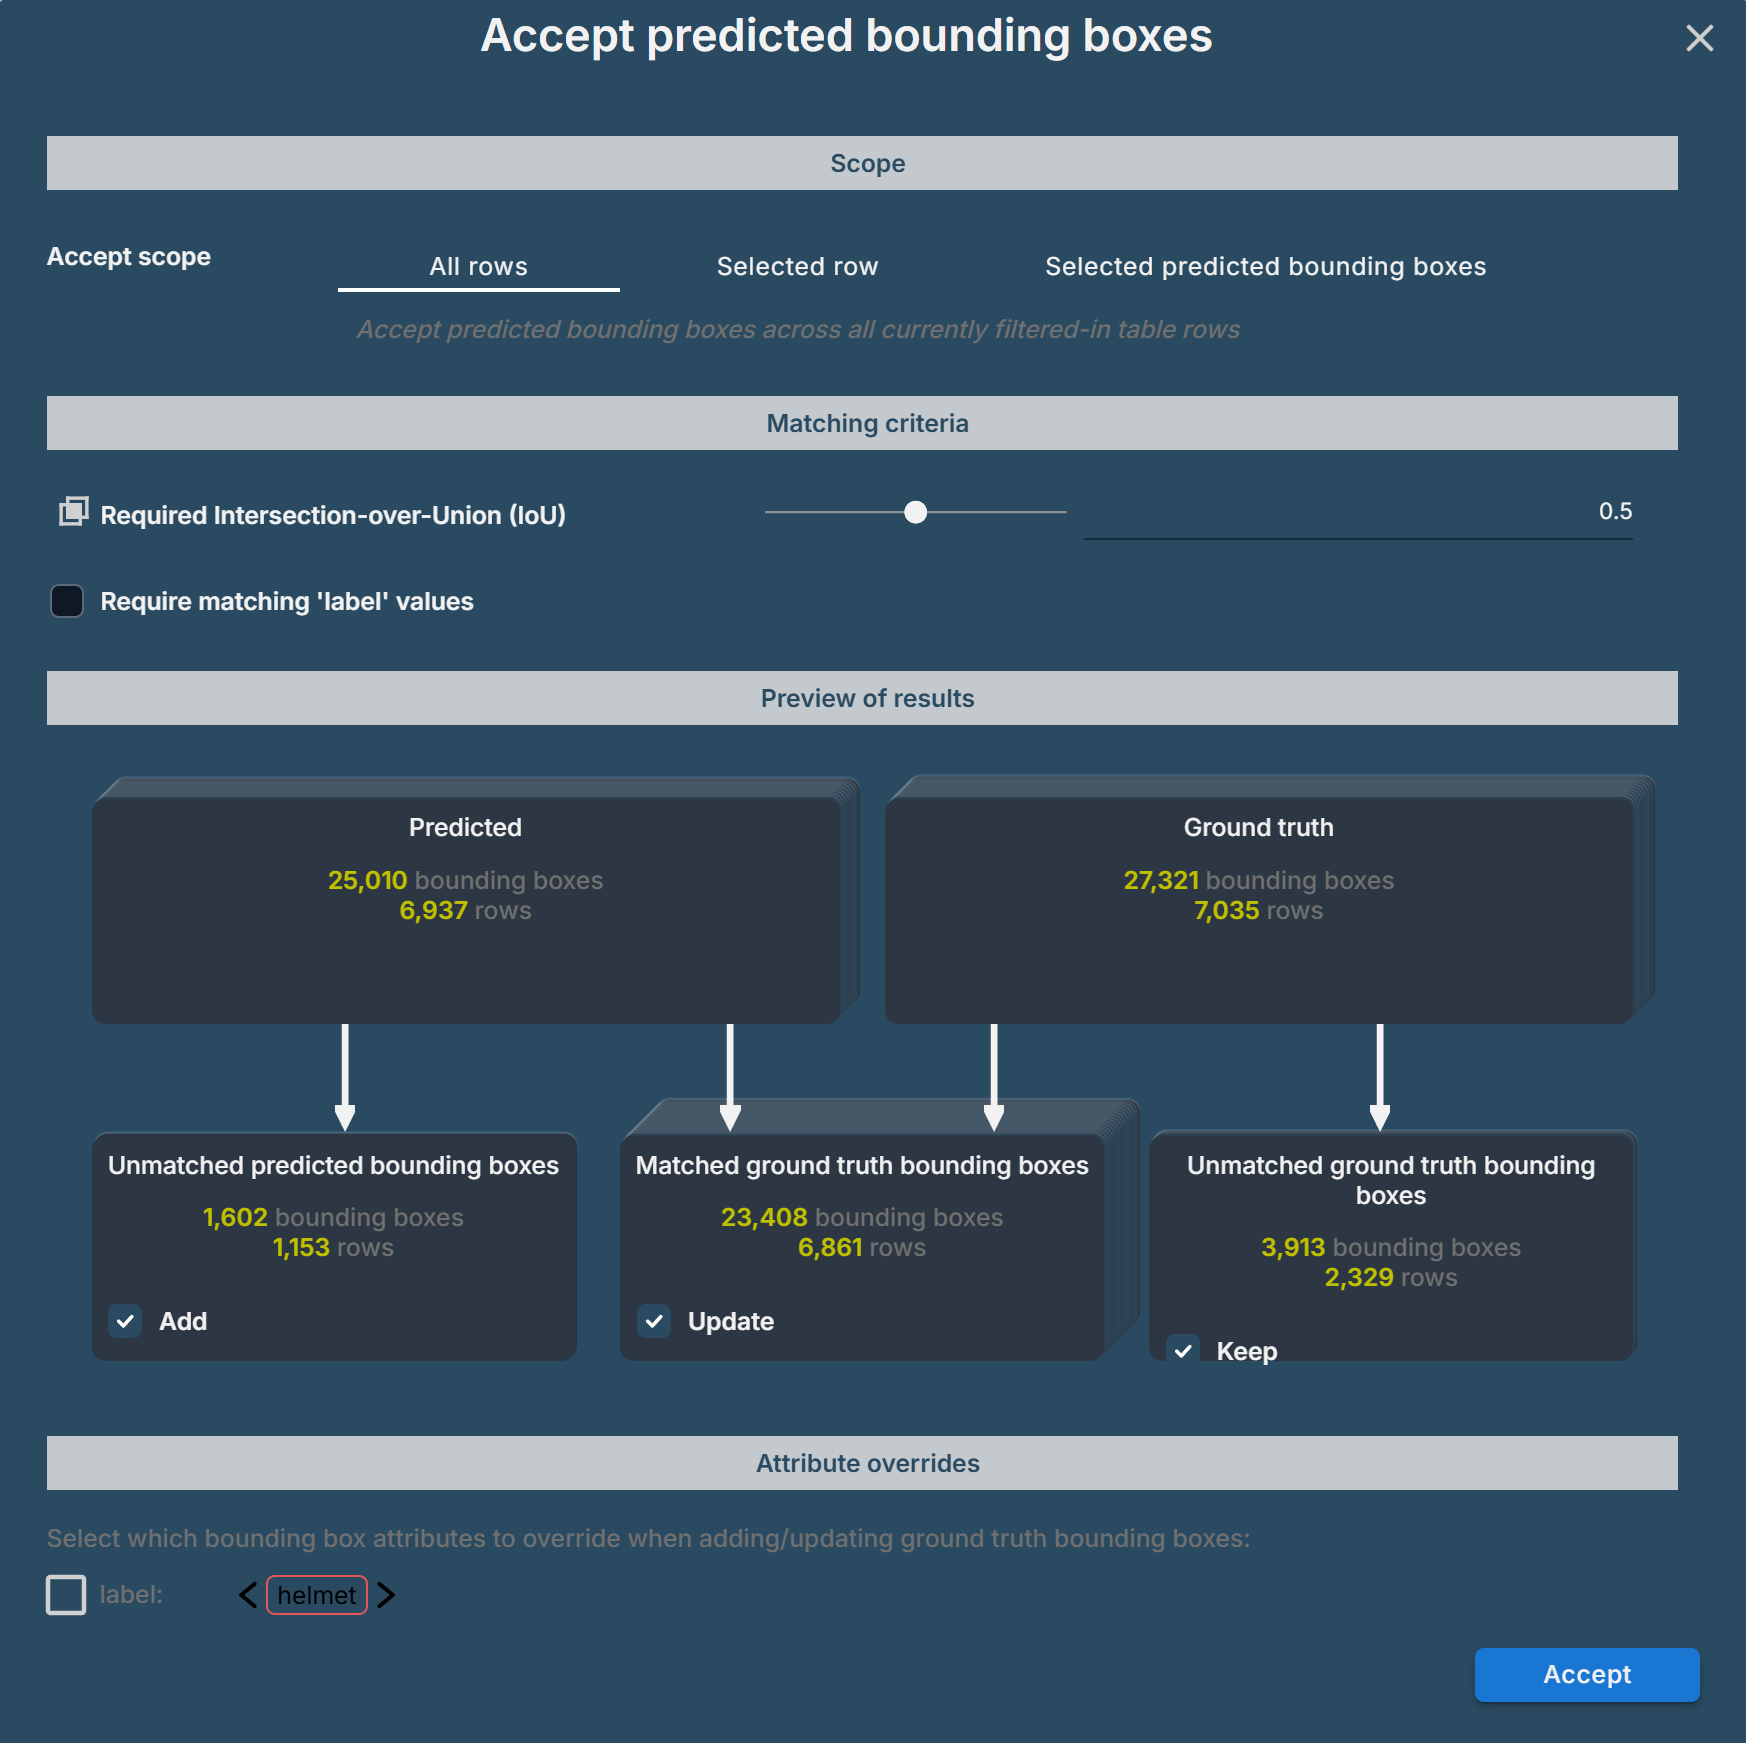
The figure below shows the default setup in the Accept predicted bounding boxes dialog. You can modify any of the
fields based on your needs. Any changes in the dialog will be automatically updated and used as the criteria for
subsequent BB conversion operations.
The dialog has four sections, including Scope, Matching criteria, Preview of results, and Attribute overrides.
Scope
The scope determines which BBs changes made with the dialog will be applied to.
Options for the scope include:
All rows
Selected row
Selected predicted bounding boxes
When this dialog is brought up by one of the three methods, the corresponding scope will be automatically focused. For
instance, when you bring up this dialog by selecting Accept selected predictions as described above, the scope
Selected predicted bounding boxes will be focused. You can always click and change to other scopes in the dialog. It’s
worth noting that when you click the Accept button, changes will be applied to BBs in the focused scope.
The scope determines at a high level the input BBs that the dialog applies to. The criteria in the remaining sections then define how matches are selected between predicted and ground truth BBs and what changes will be made, whether scoped to selected BBs or batch assigning for all rows of the entire dataset.
Matching criteria
There are two parameters under the Matching criteria. Required IOU is an IOU threshold with default 0.5. A ground
truth BB is considered matched if the IOU between this ground truth BB and the selected predicted BB(s), or all
filtered-in predicted BBs for the given image if none of predicted BBs are selected, exceeds the IOU threshold. Note: if
there are multiple ground truth BBs with IOUs that are with respect to the same predicted BB and exceed the threshold,
only the one with the highest IOU is considered matched and the rest are unmatched. The predicted BB used to pair a
matched ground truth BB is considered matched. Otherwise, it will be as an unmatched.
Require matching label values is a matching criterion optionally applied in addition to the Required IOU. When
toggled on, it requires that the ground truth BB and the predicted BB share the same label to be considered a match.
Preview of results
This section provides a visual preview of the changes that will be made if the dialog is accepted. The top portion
contains two diagram boxes representing the current number of Predicted BBs and Ground truth BBs in scope. Those
diagram boxes are connected via white arrows to three diagram boxes in the bottom portion categorizing the predicted and
ground truth BBs into Unmatched predicted BBs, Matched ground truth BBs, and Unmatched ground truth BBs, according
to the matching criteria defined in the section above. All of the diagram boxes in the preview section have their depth
scaled by the number of BBs they represent to allow for visual comparison of the numbers involved.
The number of matched predicted BBs is always equal to the number of matched ground truth BBs as they are paired. Thus,
as illustrated in the diagram chart, the sum of Unmatched predicted BBs and Matched ground truth BBs is equal to the
selected predicted BBs or the filtered-in predicted BBs, and the sum of Matched ground truth BBs and Unmatched ground truth BBs is equal to the ground truth BBs.
Each of the boxes in the bottom portion of the section contains a checkbox to determine what will be done with the BBs in that category.
Checking the
ADDoption in theUnmatched predicted BBsbox specifies that the unmatched predicted BBs should be added as ground truth BBs. Unchecking theADDbutton specifies that the unmatched predicted BBs should not be added as ground truth BBs, i.e. that they should remain as predicted BBs.Checking the
UPDATEoption in theMatched ground truth BBsbox specifies that the existing ground truth BBs matched by predicted BBs should be replaced with those matching predicted BBs. Unchecking theUPDATEbutton means that the pairs of matching predicted BBs and ground truth BBs should be left as-is.Checking the
KEEPoption in theUnmatched ground truth BBsbox specifies that those ground truth BBs should be kept as ground truth BBs. Unchecking theKEEPoption means that those unmatched ground truth BBs should be deleted.
Attribute overrides
This section lists all available attributes that you can override when converting BBs. For instance, checking the
label box and selecting a desired label will override the labels of all converted BBs to the selected one. This
setting is often used when you want to assign a set of false positive predictions to a new class.
With all the settings, click the Accept button to complete the BB conversion. Next time, if you do not intend to
change the settings, you can select Immediately accept selected predictions to bypass the dialog and use the existing
settings.
Converting predicted BBs on a sample
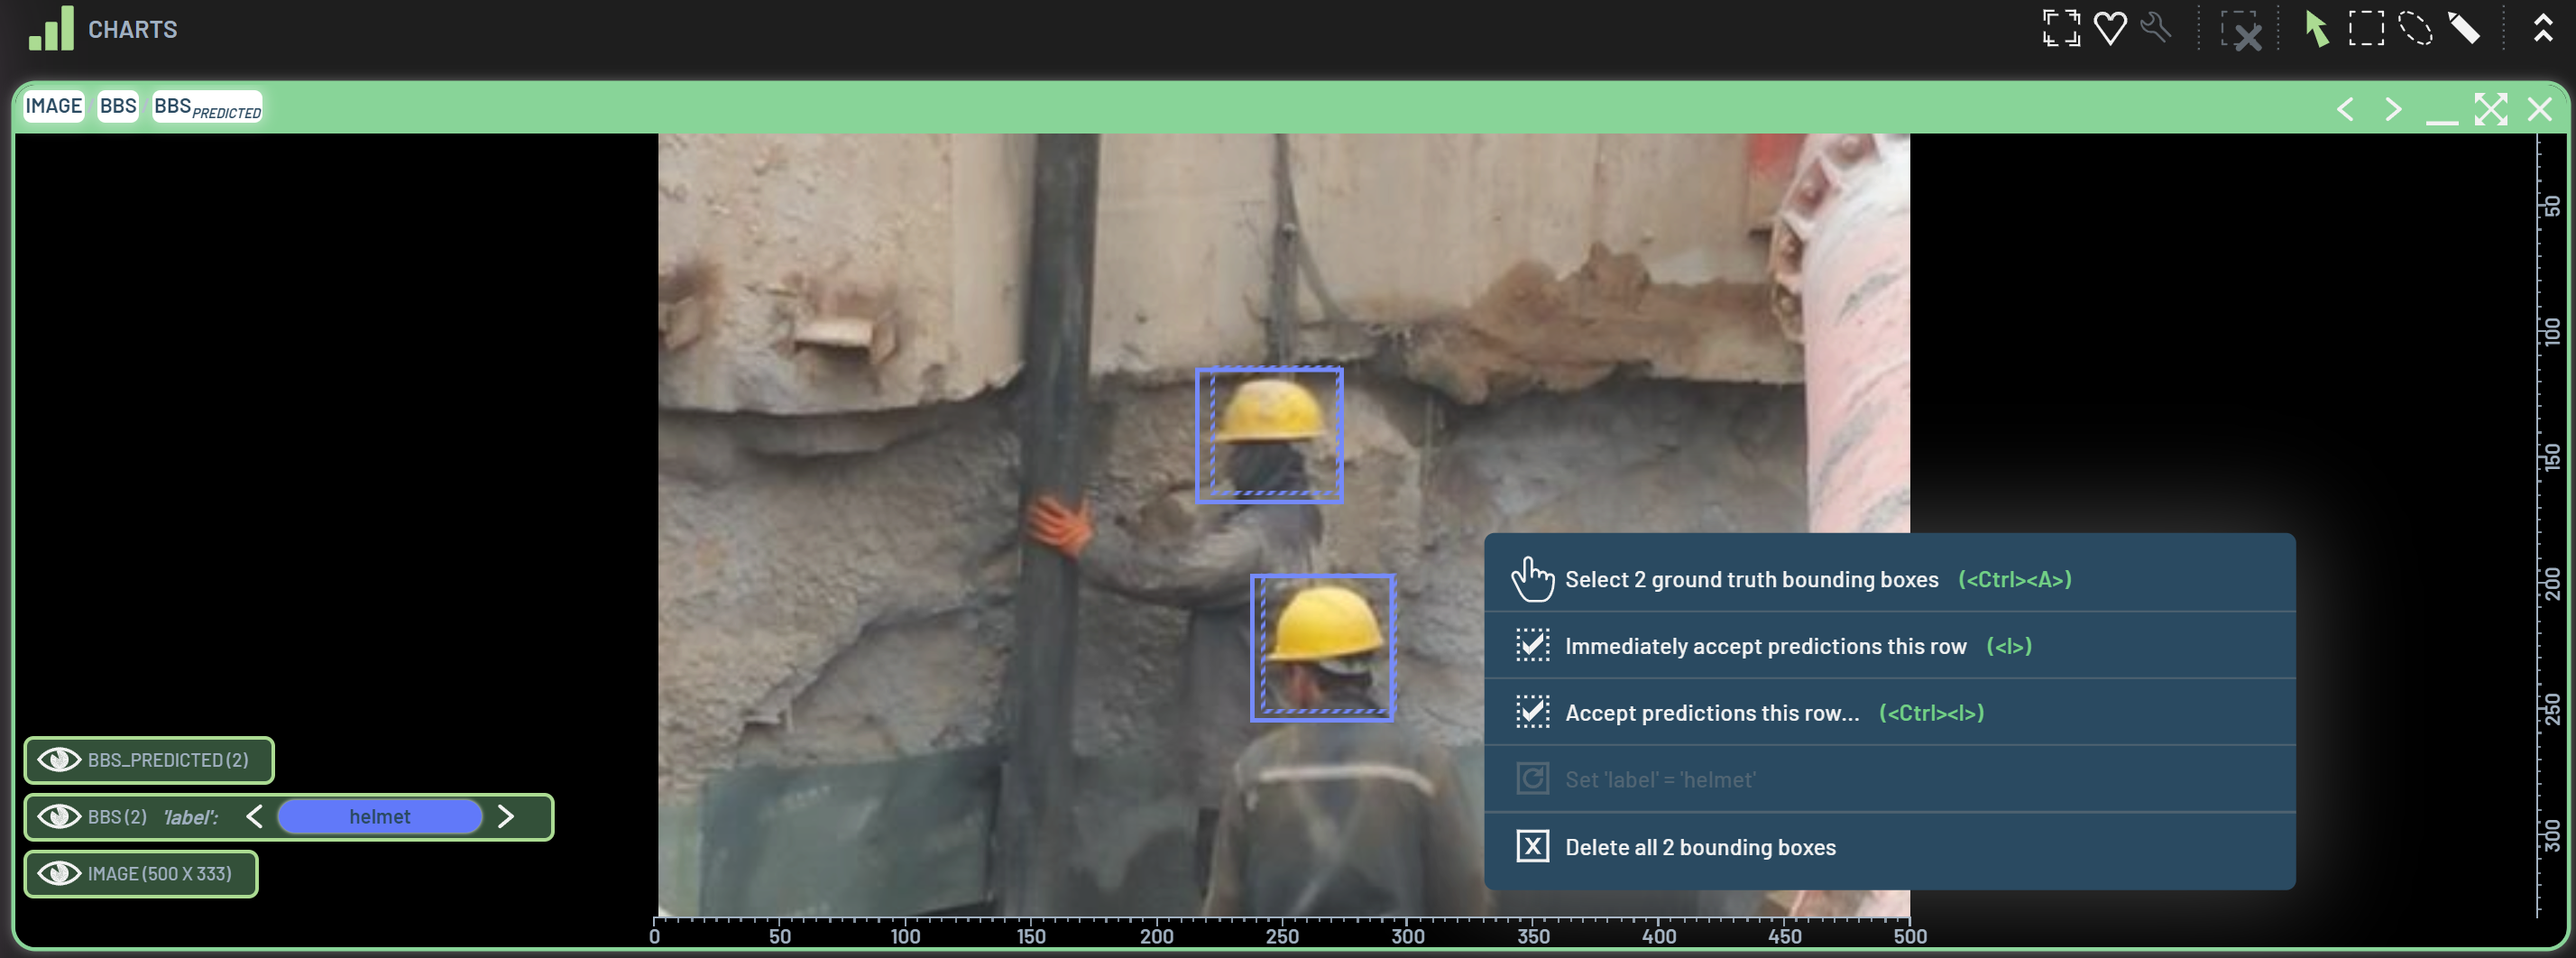
To convert all predicted BBs on a sample, RightClick on anywhere (non-BB area) in a chart with
predicted BBs. You can select either Immediately accept predictions this row or Accept predictions this row. The
latter will bring up the same Accept predicted bounding boxes dialog except that the scope Selected row will be
focused. If you do not want to change any settings in the dialog, you can bypass it by selecting Immediately accept predictions this row. Note: only filtered-in predicted BBs will be converted, but all ground truth BBs on this sample
will be considered for matching, even if they are filtered out.

Batch assigning all predicted BBs on all samples
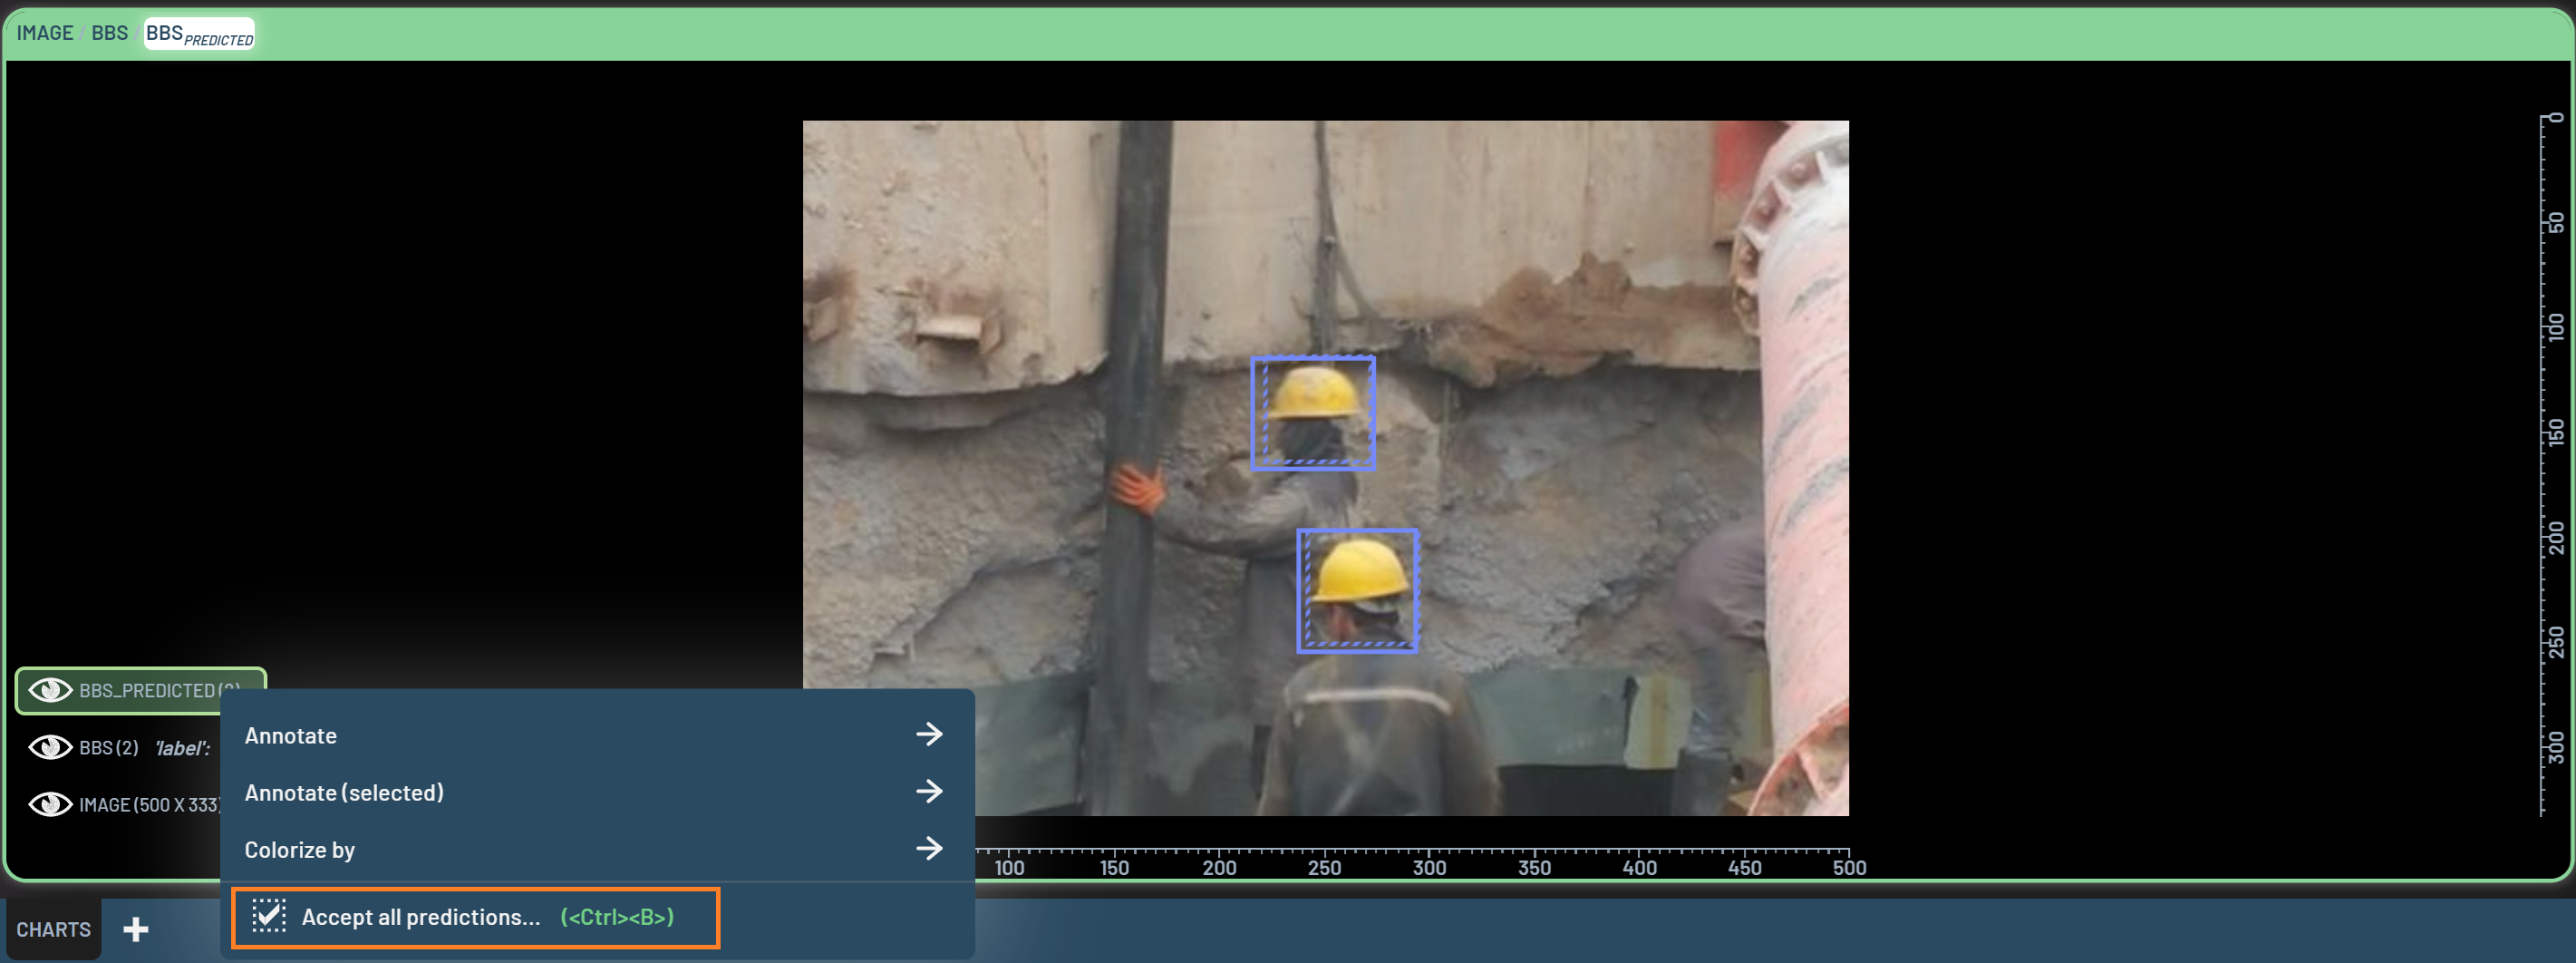
Similar to converting predicted BBs on a sample, batch assignments for filtered-in predicted BBs on all samples can be done in one of three ways:
RightClick on the
BBS_PREDICTEDmenu at the lower left corner of the chart (see figure below)Press shortcut Ctrl + B
Switch the scope to
All rowson an openedAccept predicted bounding boxesdialog

In the Accept predicted bounding boxes dialog, the scope is on All rows and all other settings are the same as
before if you have changed some previously. The numbers of BBs and rows in each diagram box under Preview of results
give you a preview of how many BBs will be added/not added, updated/not updated, and kept/not kept (removed). Once you
are satisfied with all of the settings, click Accept to complete the batch assignments.
Operations
Derive BB-related virtual properties
BB-related virtual properties are essentially a group of virtual columns derived from
either BBs or BBspredicted or both. These virtual properties can be used the same
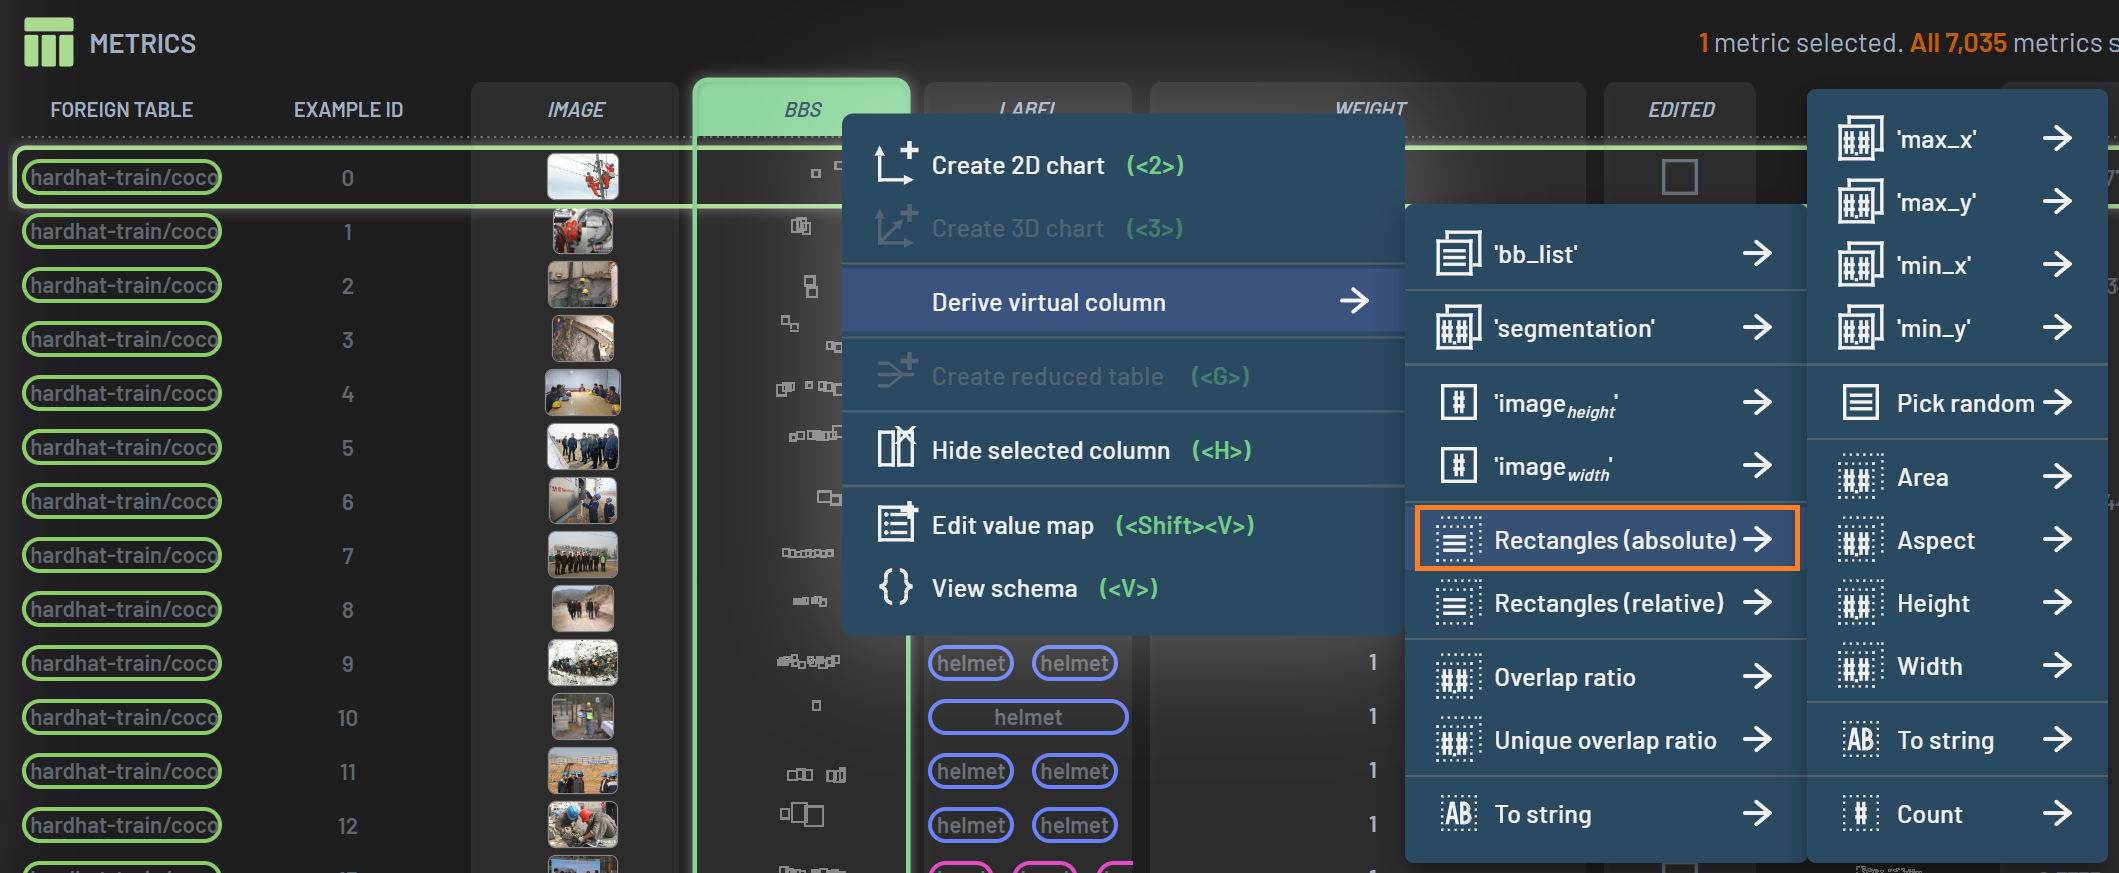
way as the collected BB metrics. All available virtual properties are listed under Derive virtual column in the popup
menu when RightClick’ing a selected bounding box column.
On one single BBs column
Some commonly used virtual properties of BBs or BBspredicted include:
Rectangles(absolute): An array of four absolute values in form of [min_x, min_y, max_x, max_y] for each BB
Rectangles(relative): An array of four relative values in form of [min_x, min_y, max_x, max_y] for each BB
Area: Area for each BB
Aspect: Aspect ratio for each BB
Height: Height of each BB
Width: Width of each BB

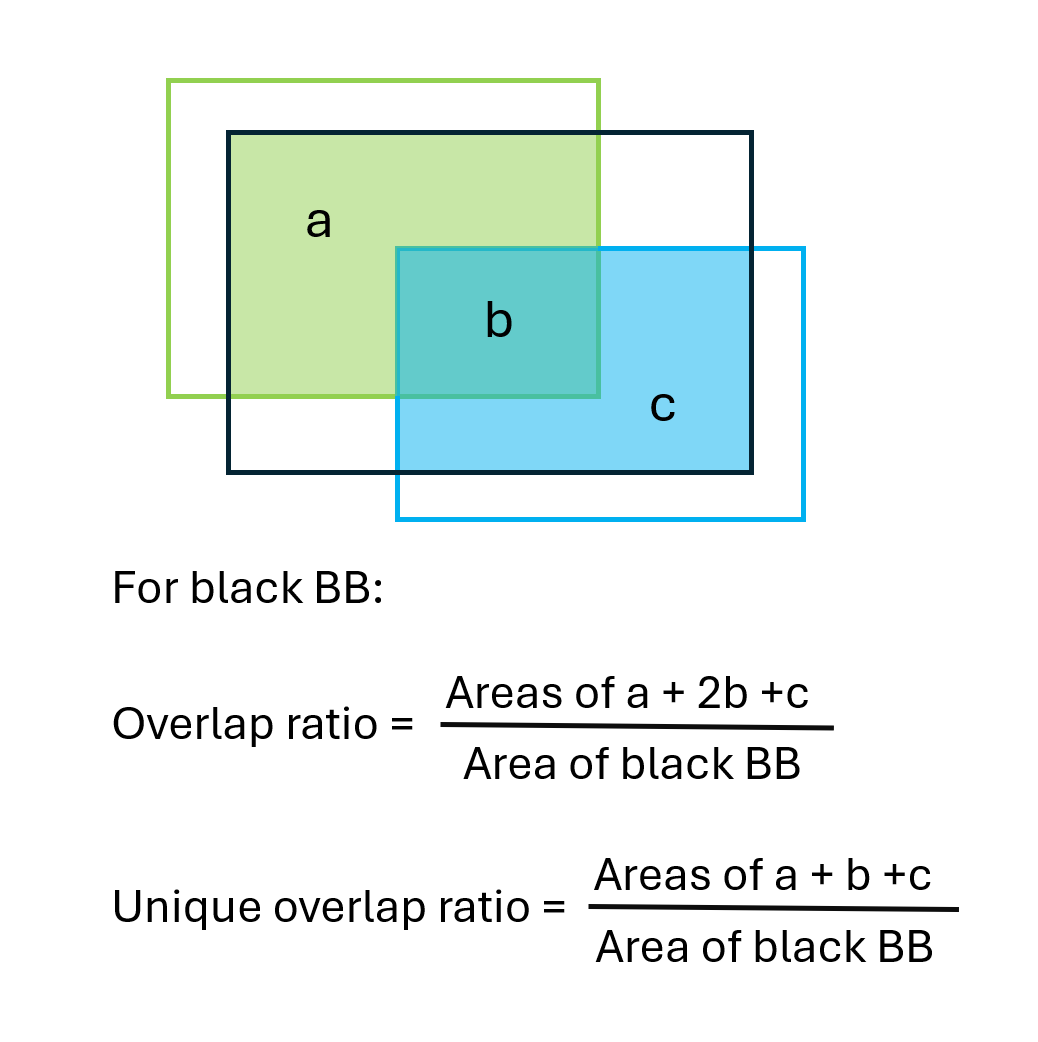
Overlap ratio: Sum of overlapped areas of a given BB with all other BBs divided by area of this BB; value can be greater than 1
Unique overlap ratio: Sum of unique overlapped areas of a given BB with all other BBs divided by area of this BB; value is equal to or less than 1
On both ground truth and predicted BBs columns
Some commonly used virtual properties derived from selecting both BBs and BBspredicted include:
IoUmatched_ground_truth: Intersection over union between ground truth and predicted BBs. This is computed for each ground truth BB against its matching predicted BB, so it is a property of ground truth BBs.
IoUmatched_prediction: Intersection over union between predicted and ground truth BBs. This is computed for each predicted BB against its matching ground truth BB, so it is a property of predicted BBs.
Matched ground truth (TP): True positives with default IoU threshold of 0.5, which is adjustable. This is computed for each ground truth BB against its matching predicted BB, so it is a property of ground truth BBs.
Matched prediction (TP): True positives with default IoU threshold of 0.5, which is adjustable. This is computed for each predicted BB against its matching ground truth BB, so it is a property of predicted BBs. Note: The number of the matched ground truth TPs should be always equal to the number of the matched prediction TPs.
Unmatched ground truth (FN): False negatives with default IoU threshold of 0.5, which is adjustable. This is computed for each ground truth BB against its matching predicted BB, so it is a property of ground truth BBs.
Unmatched prediction (FP): False positives with default IoU threshold of 0.5, which is adjustable. This is computed for each predicted BB against its matching ground truth BB, so it is a property of predicted BBs.
Sum: a chained operation under FN/FP/TP; it can be used to calculate the total FNs/FPs/TPs for each sample.
You can adjust the IoU and Confidence thresholds used for counting FN/FP/TP. To adjust the IoU threshold for
FN/FP/TP, select the derived FN/FP/TP column, RightClick and hover
over Tweak virtual column, and then adjust the value either by typing in the box or dragging the slider.
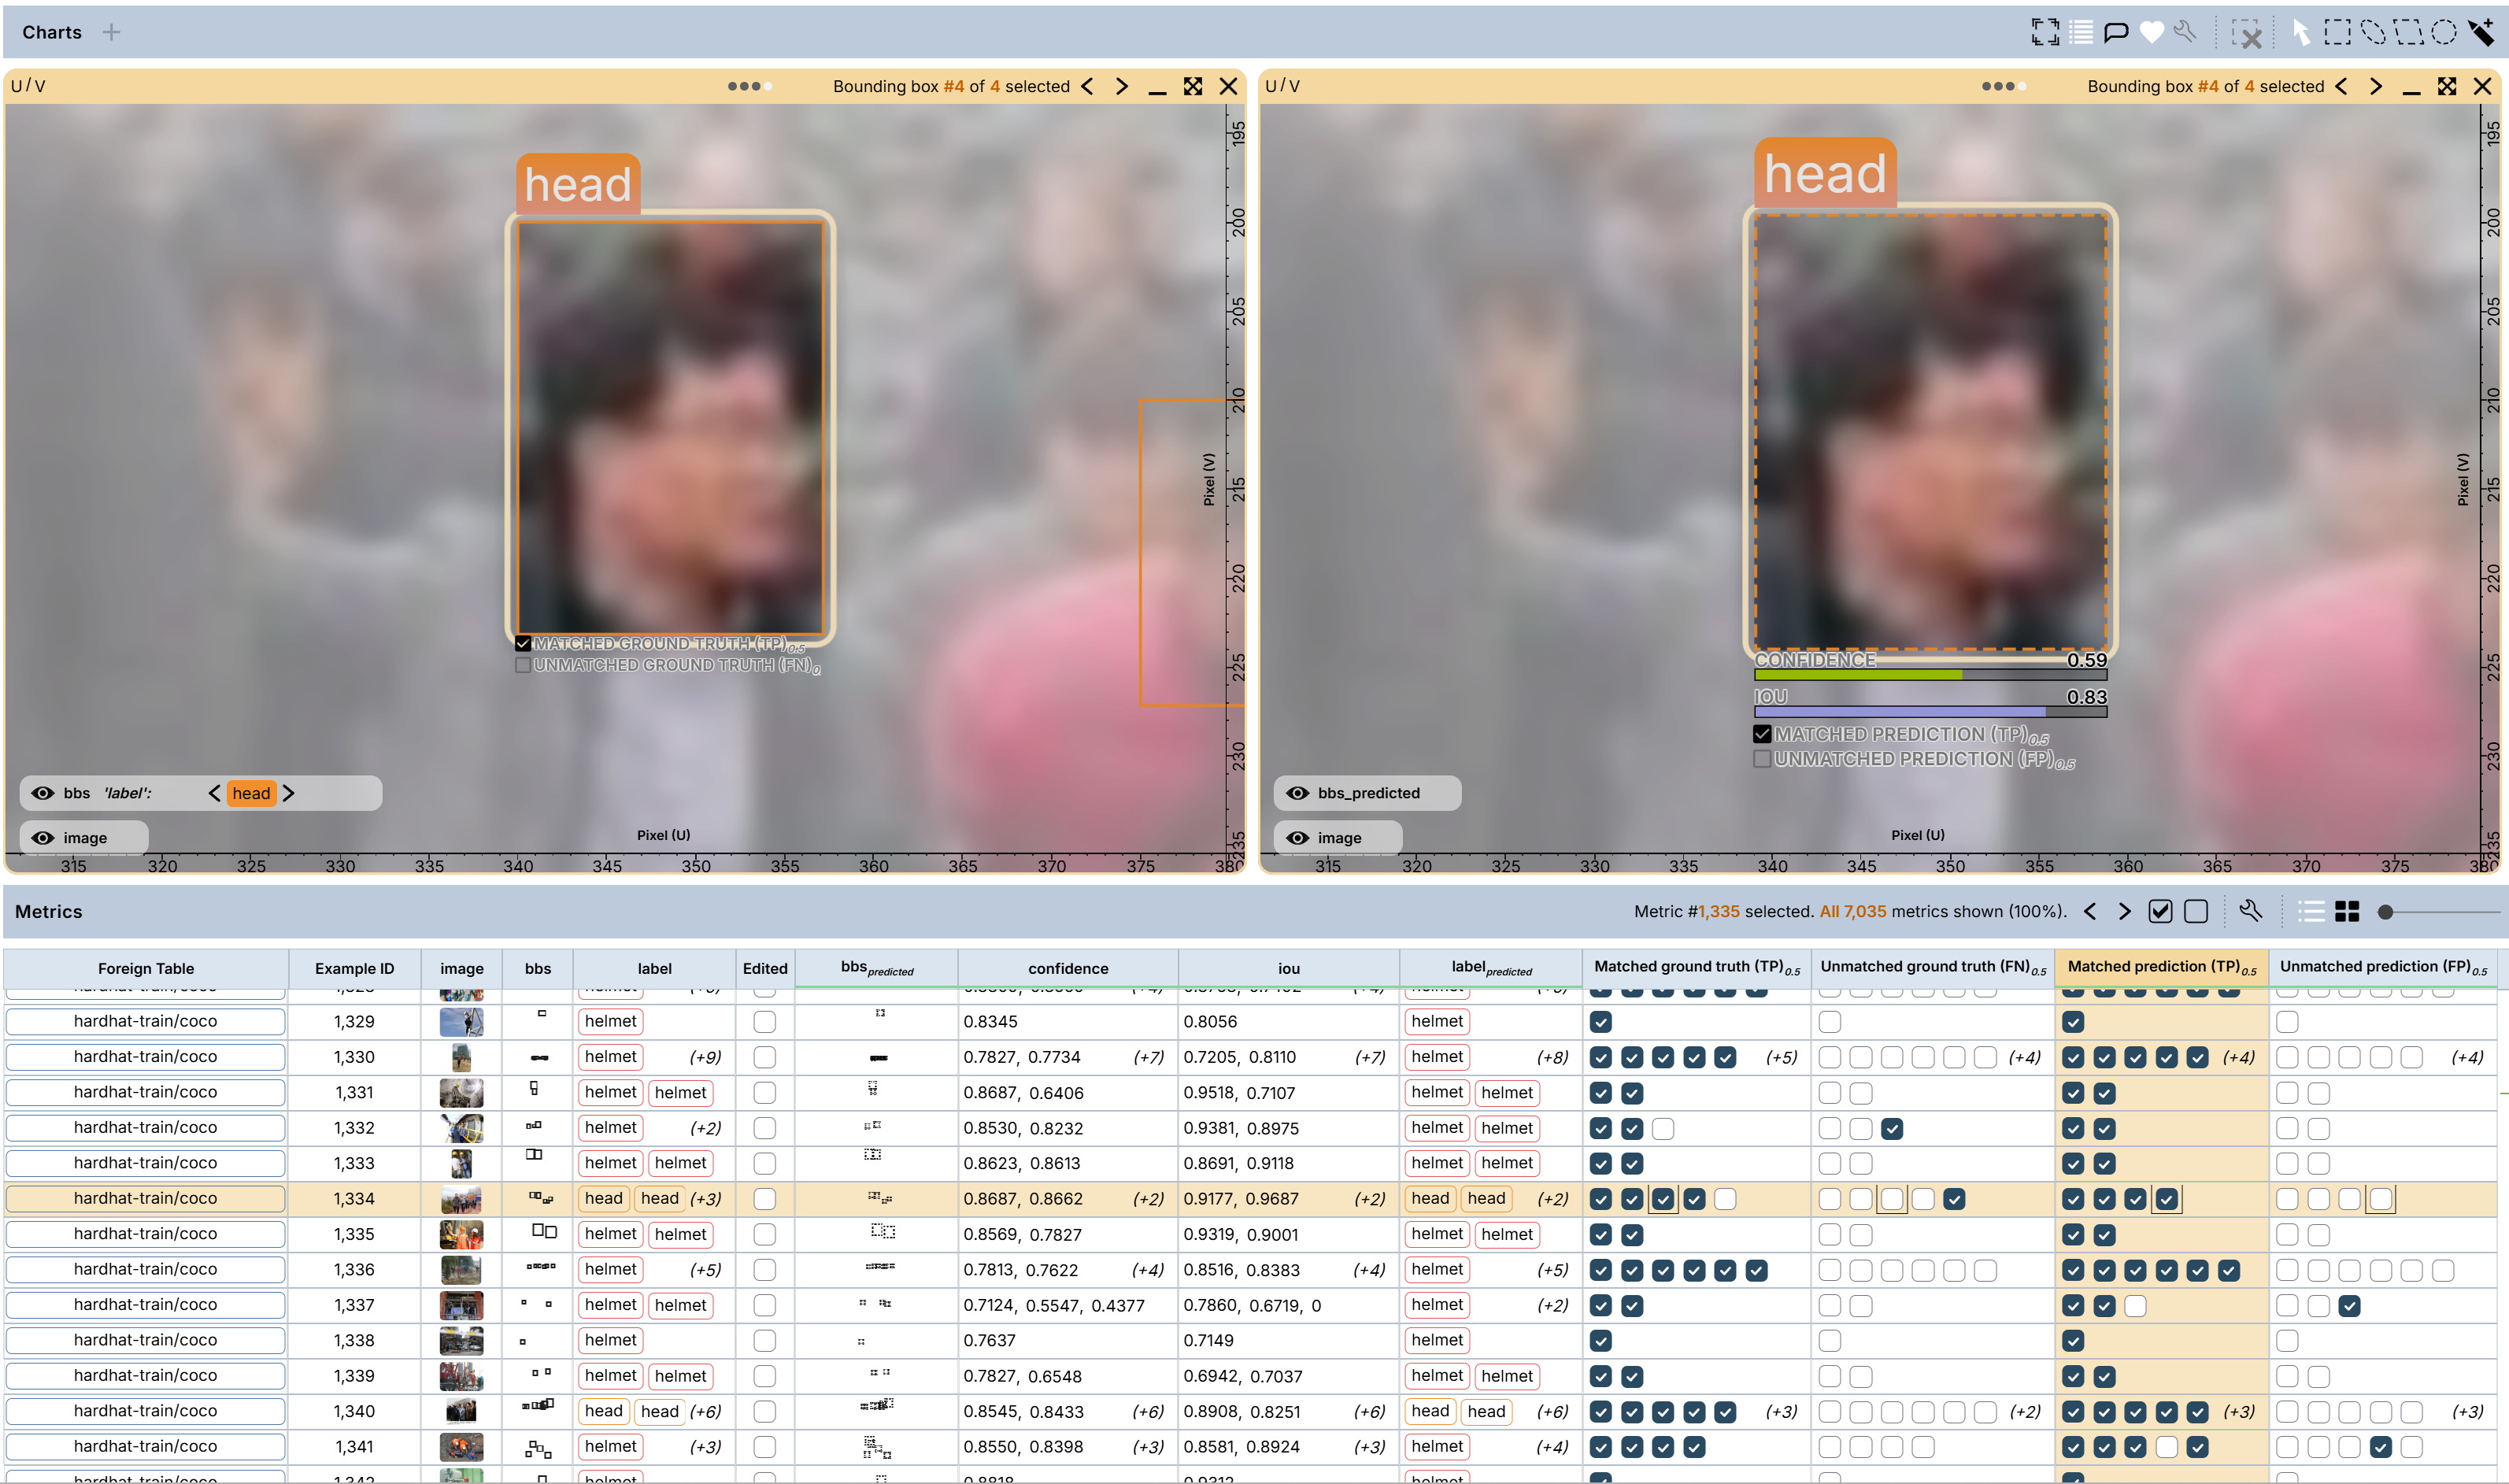
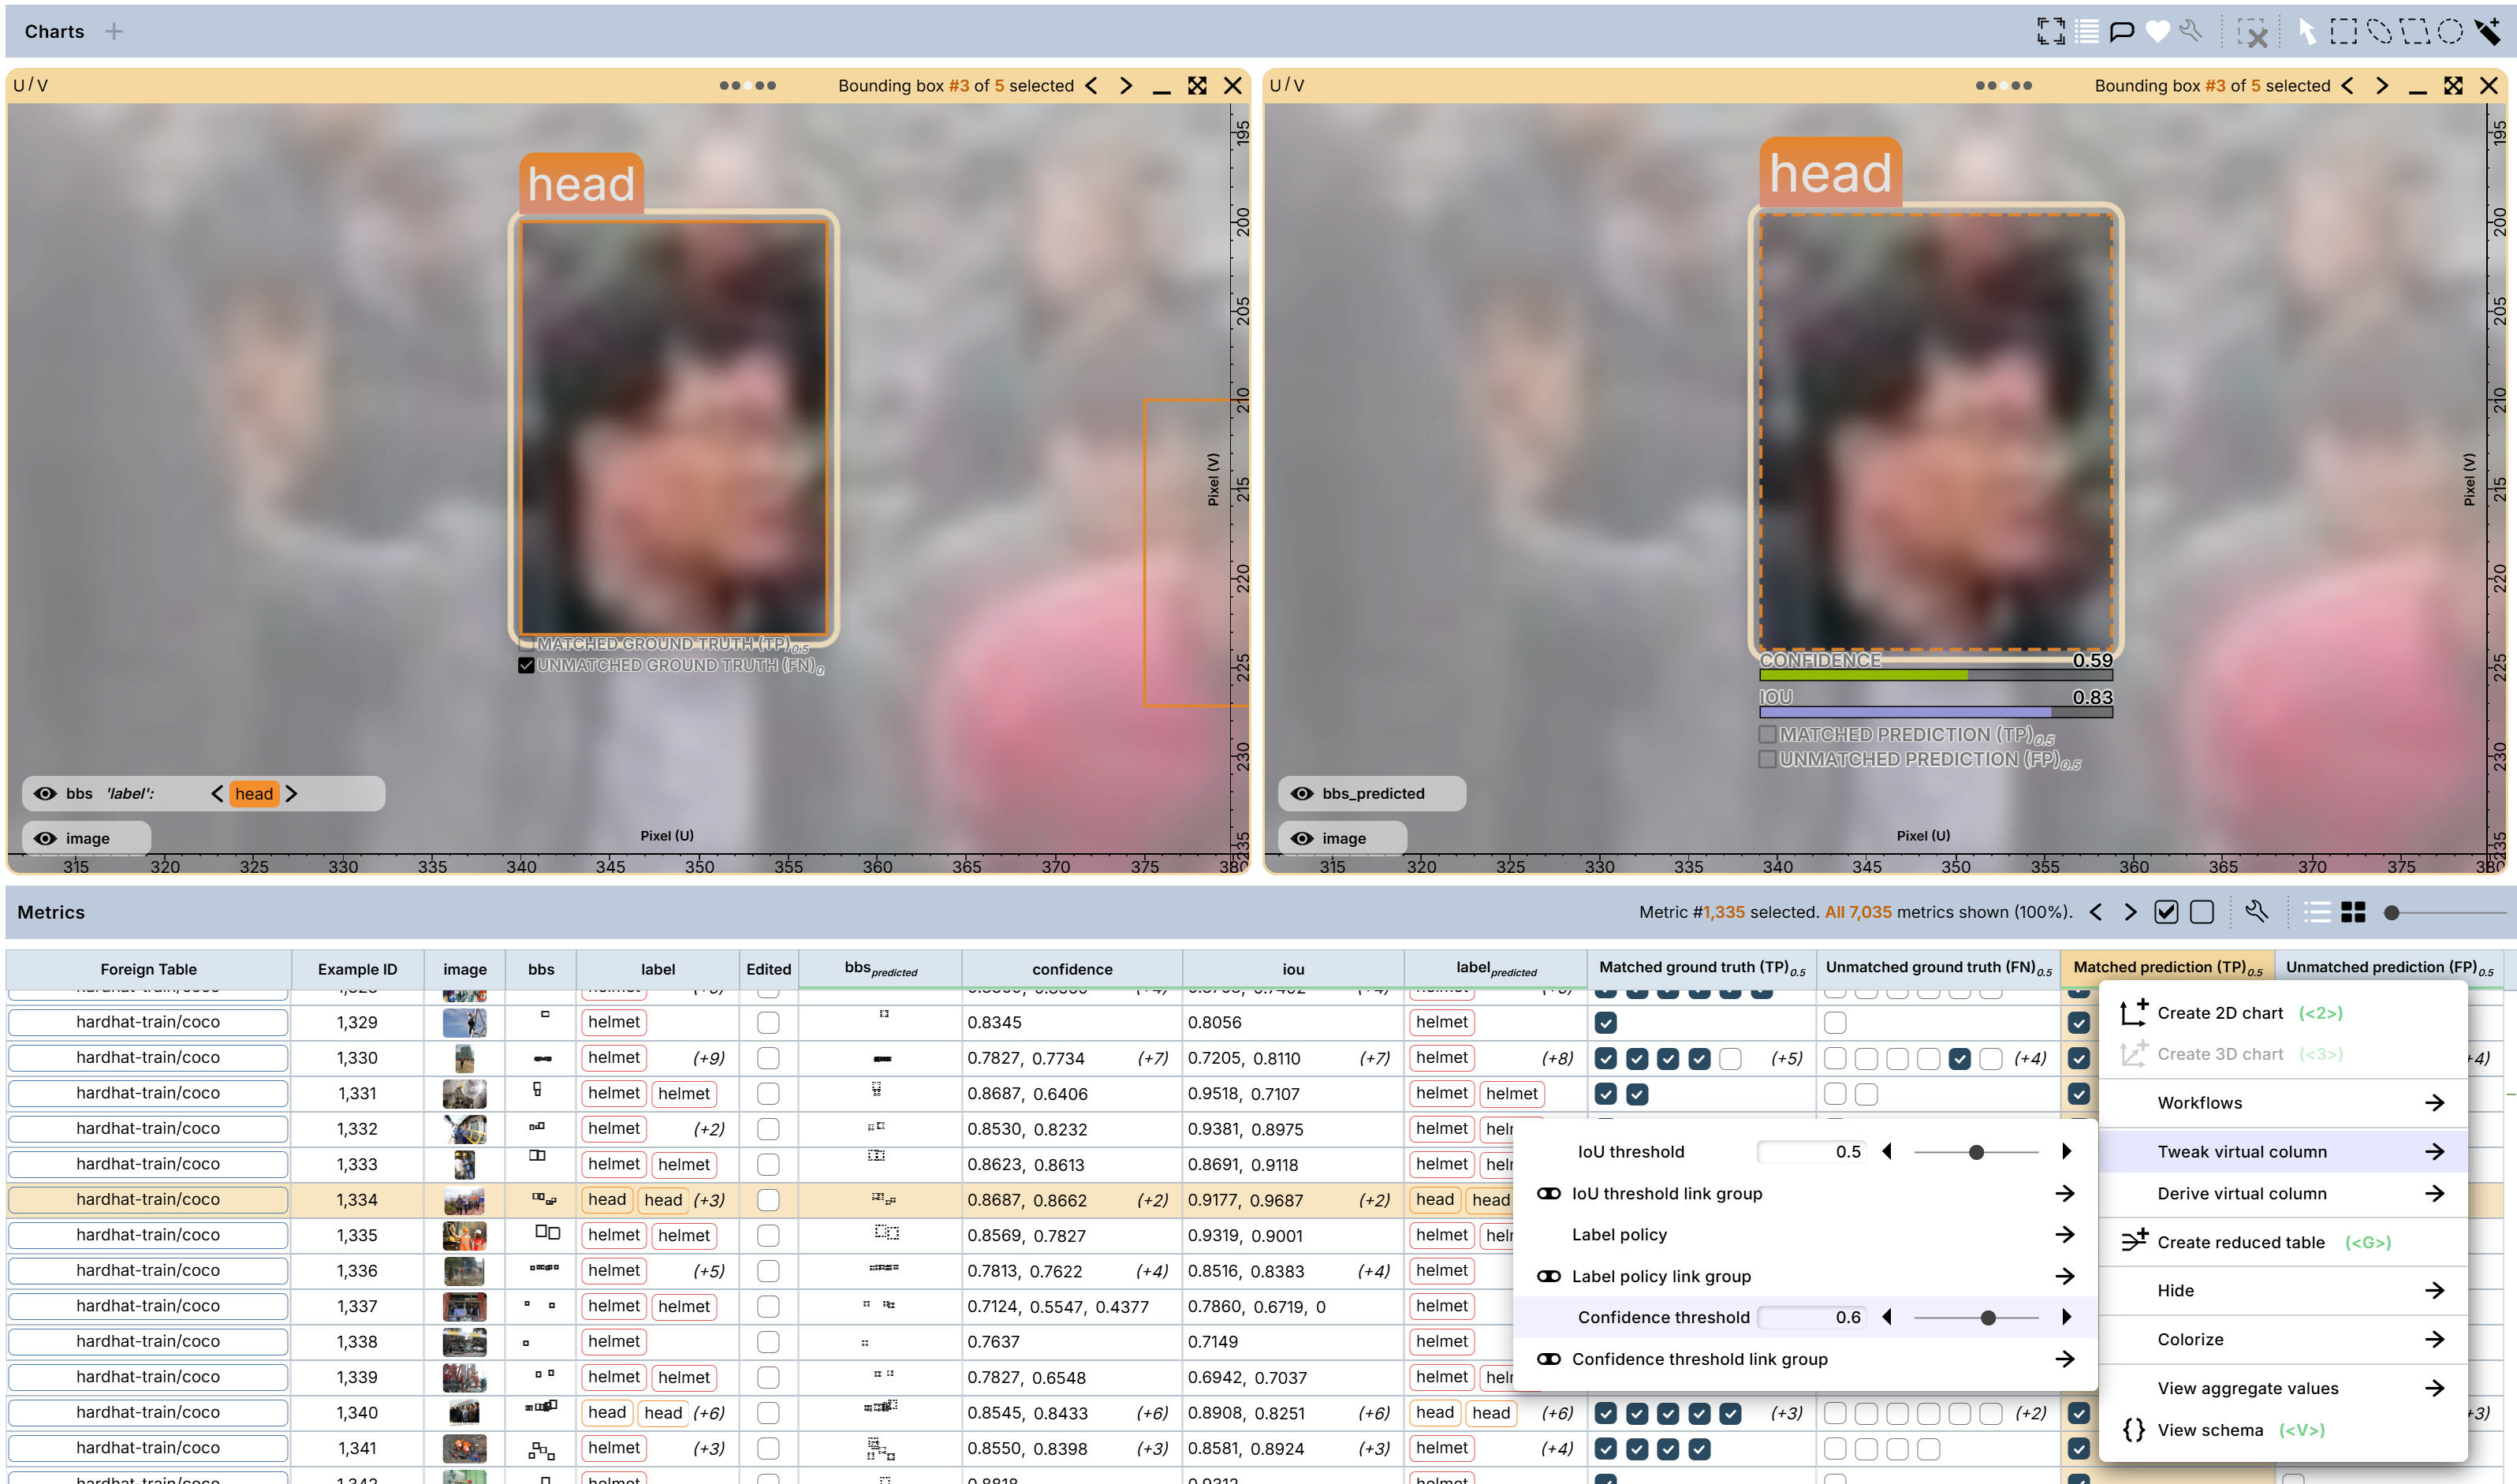
Adjusting Confidence threshold can be done in the same Tweak virtual column submenu as the IoU threshold. The default
is 0.25. For the predicted BB in the screenshot below (right chart), the confidence for the BB is 0.59 (>0.25), and IoU
is 0.83 (>0.5), so this predicted BB is a TP while it’s paired ground truth BB is also a TP (left chart).
After adjusting the Confidence threshold to 0.6, this predicted BB is no longer a TP because its confidence (0.59) falls below the current Confidence threshold 0.6. But it is not a FP either because any BBs below the Confidence threshold are treated as if they do not exist. Technically, this predicted BB at this point is TP=False and FP=False, implying that FP=False is not an equivalent to TP=True. Meanwhile, since this predicted BB is no longer considered as a candidate for matching a ground truth BB, the previously matched ground truth BB (left chart) is no longer a TP but a FN now.
It is worth nothing that adjusting IoU/Confidence thresholds for one virtual column (e.g., Matched prediction) will automatically apply the same values to other relevant virtual columns such as Unmatched prediction (FP) and Unmatched ground truth (FN), etc.
FN/FP/TP/IoU: virtual properties vs collected metrics
Like all virtual columns created in the Dashboard, FN/FP/TP/IoU virtual properties are dynamic and re-computed e.g. as ground truth BBs are edited or IoU thresholds are adjusted. On the other hand, you may have collected FN/FP/TP/IoU metrics during metrics collection that you are also able to display in the Dashboard. Keep in mind that such metrics are static (e.g. they will have the fixed IoU threshold used when collected) and they cannot be changed in the Dashboard. The dynamic character of the Dashboard virtual properties makes their use especially versatile and flexible.
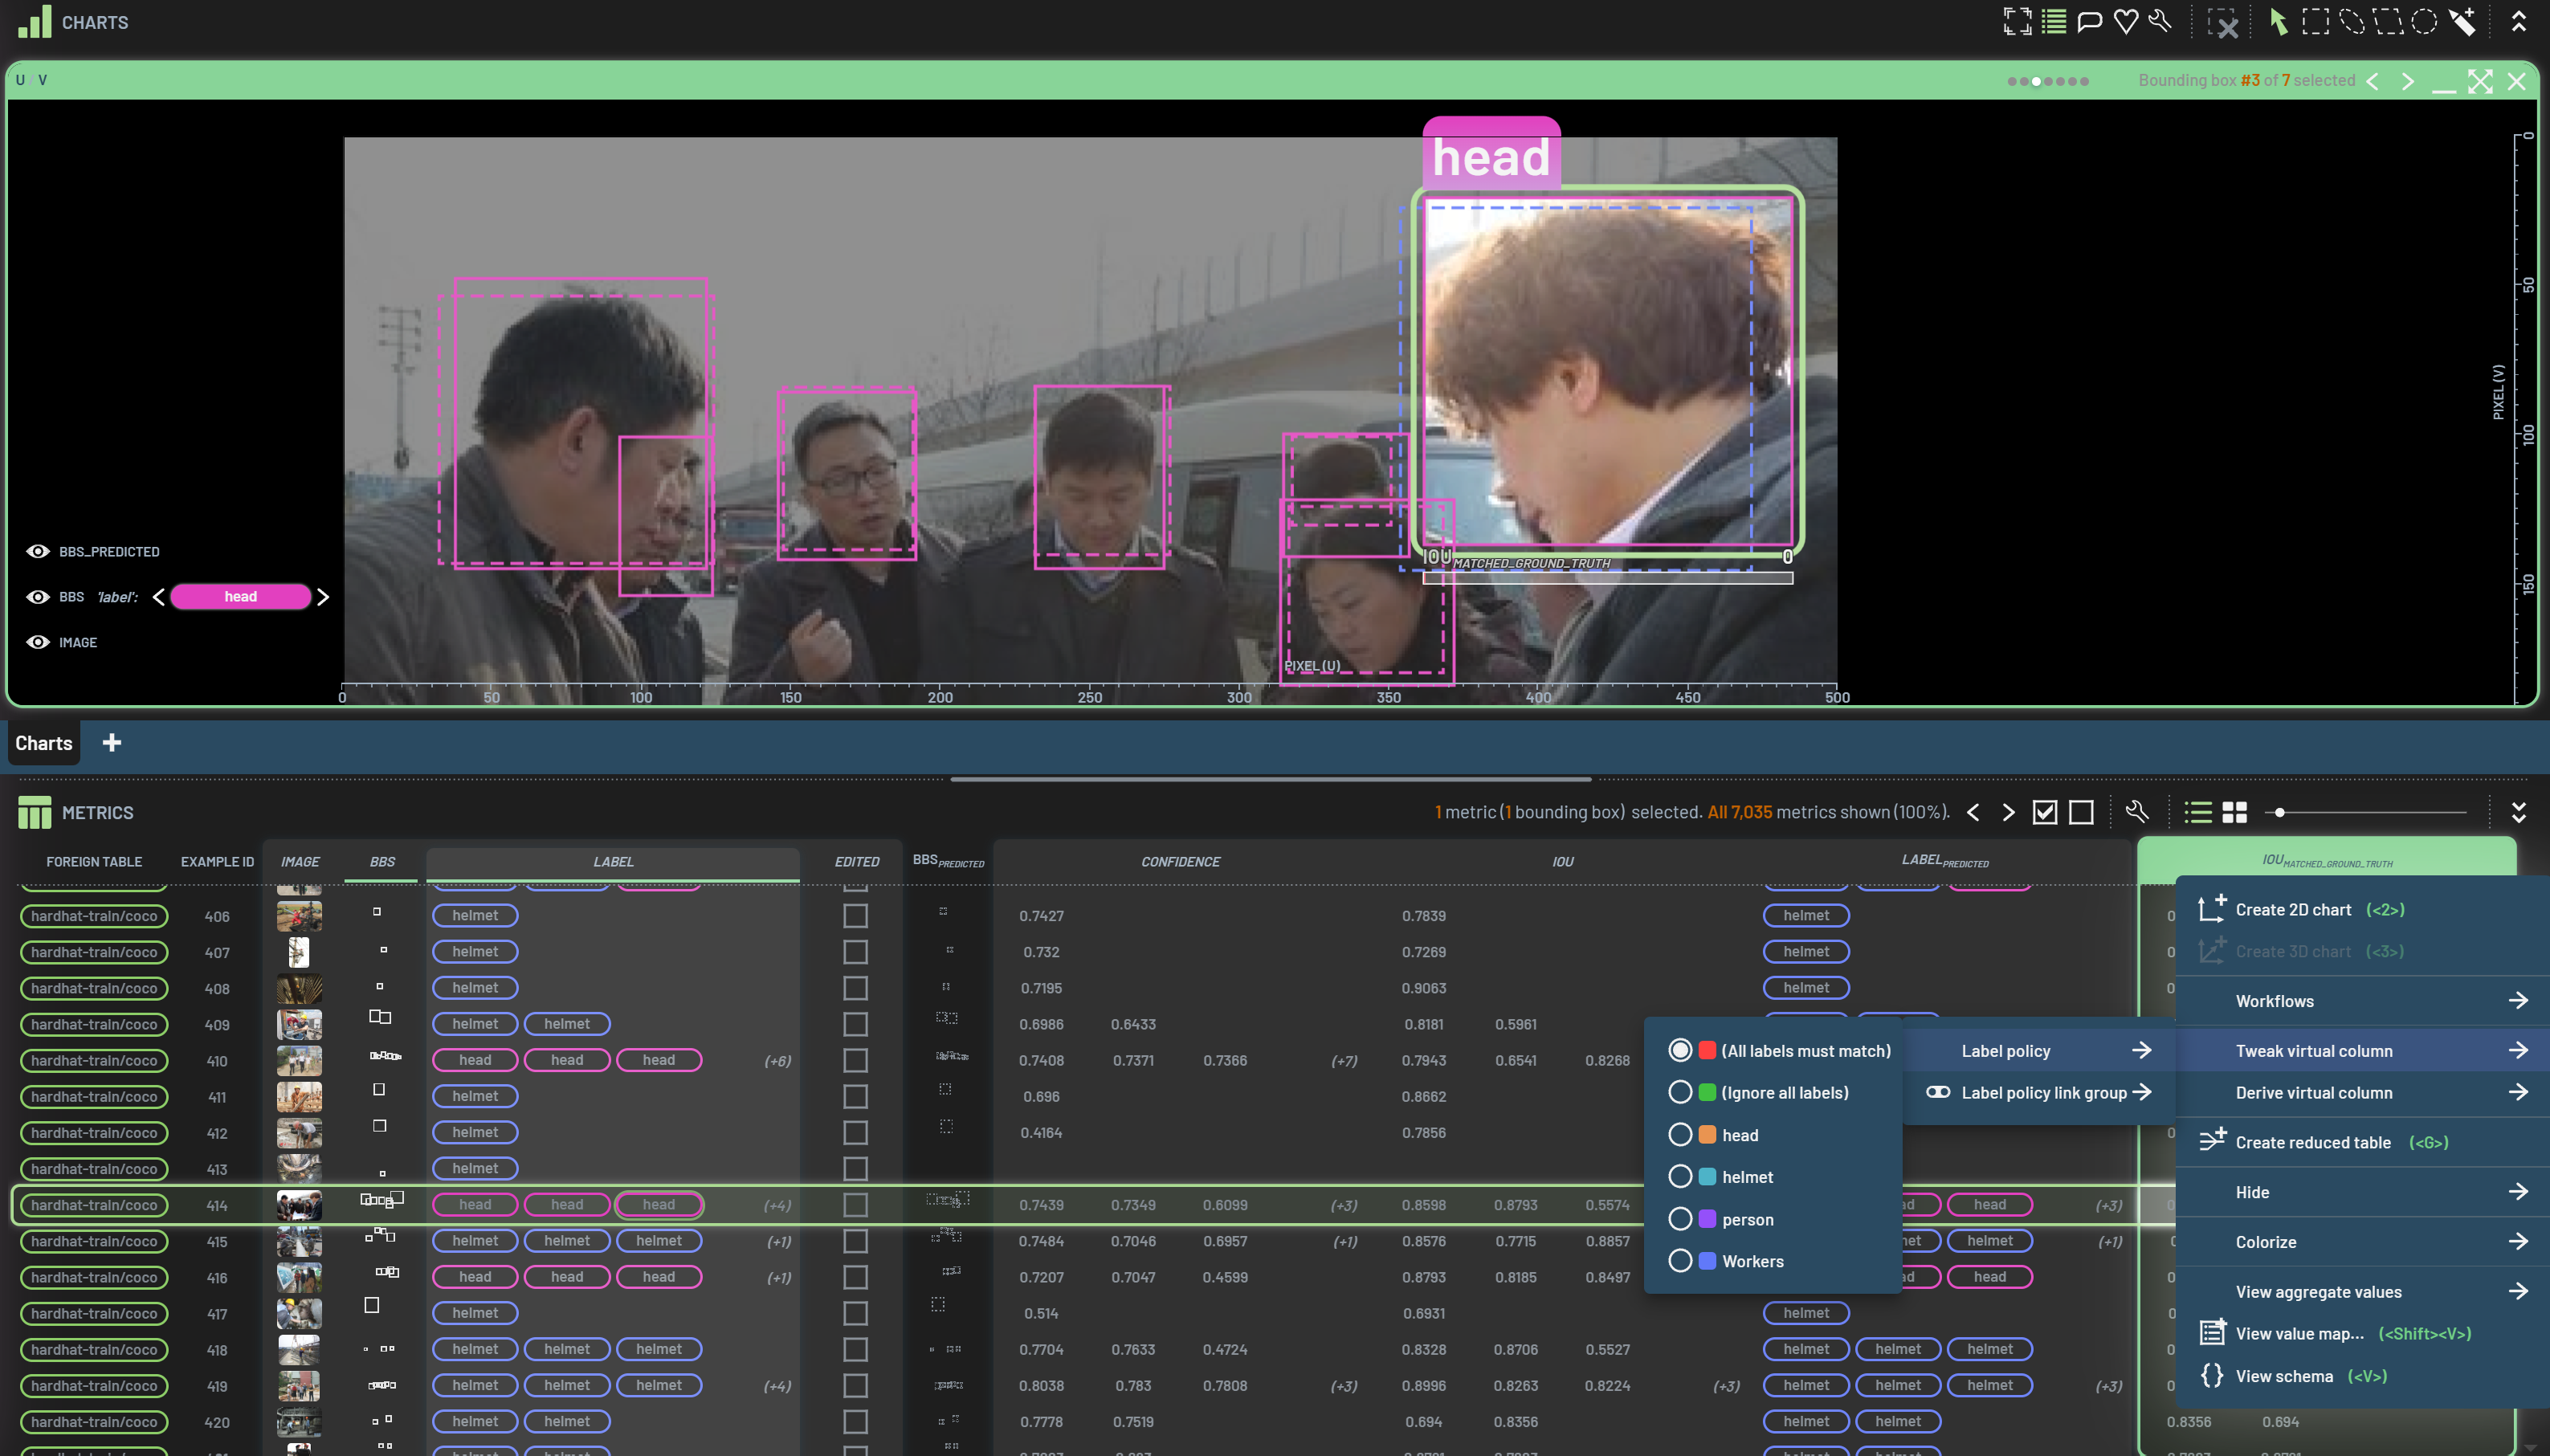
For IoU and FN/FP/TP virtual columns, there is another parameter, label policy, that you can tweak. Label policy
determines whether a matched class between the pair of ground truth and predicted BBs is required to calculate these
metrics. The default is All labels must match, which means, for example, IoU returns 0 if the BB pair has
different classes regardless of the degree of overlap (e.g., the selected BB in the screenshot). If you change the label
policy to Ignore all labels, IoU will be calculated by ignoring the classes. For this selected BB, its IoU will be
0.76 instead of 0. You can also select a specific class under label policy. That will return a non-zero IoU only if
the BB pair has a matched class equal to the one you select.
On three columns: ground truth BBs, predicted BBs, and a property column
When a property of ground truth BBs or predicted BBs is selected along with BBs and BBspredicted, a matched property of the counterpart can be derived. Note: the property column needs to be selected after selecting the two BBs columns. For example, the ground truth Label is selected along with the two BBs columns. A virtual column called Labelmatched can be derived.
The derived Labelmatched column is a counterpart of the Labelpredicted, which means that the Labelmatched column is a property of predicted BBs (rather than ground truth BBs) and these two label columns have the same array signature. When a predicted BB is selected, two “labels” are displayed above the BB in a chart: predicted label (lower) and matched label (upper) as shown in the screenshot. The matched label is from the label of the matched ground truth BB. Note: the default matching criteria here are based on IoU and Confidence (not label policy), but they are all tweakable. By having a label pair for each predicted BB, a confusion matrix can be created after an occurrence column is derived from the Labelpredicted and Labelmatched columns.
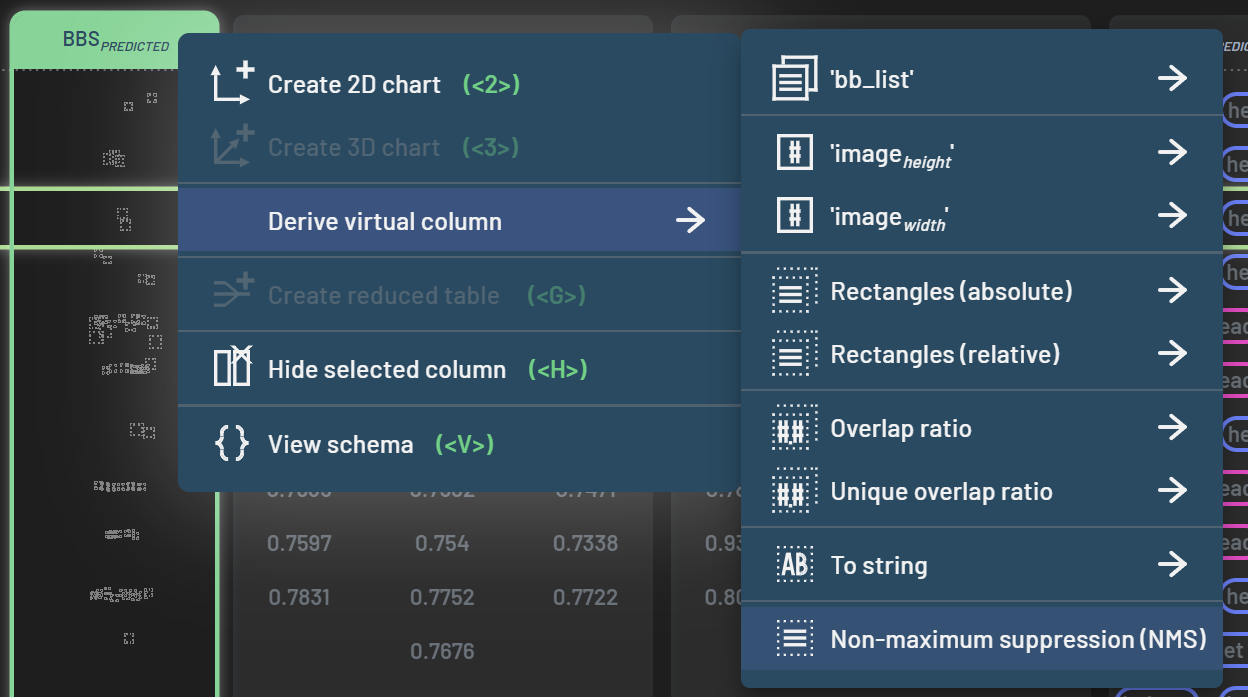
Non-Maximum Suppression (NMS)
If your model makes some overlapped duplicate BBs, you can use the built-in NMS operation to remove all the duplicate
BBs. To do so, select the BBspredicted, RightClick on the column header,
hover over Derive virtual column, and select Non-maximum suppression (NMS).
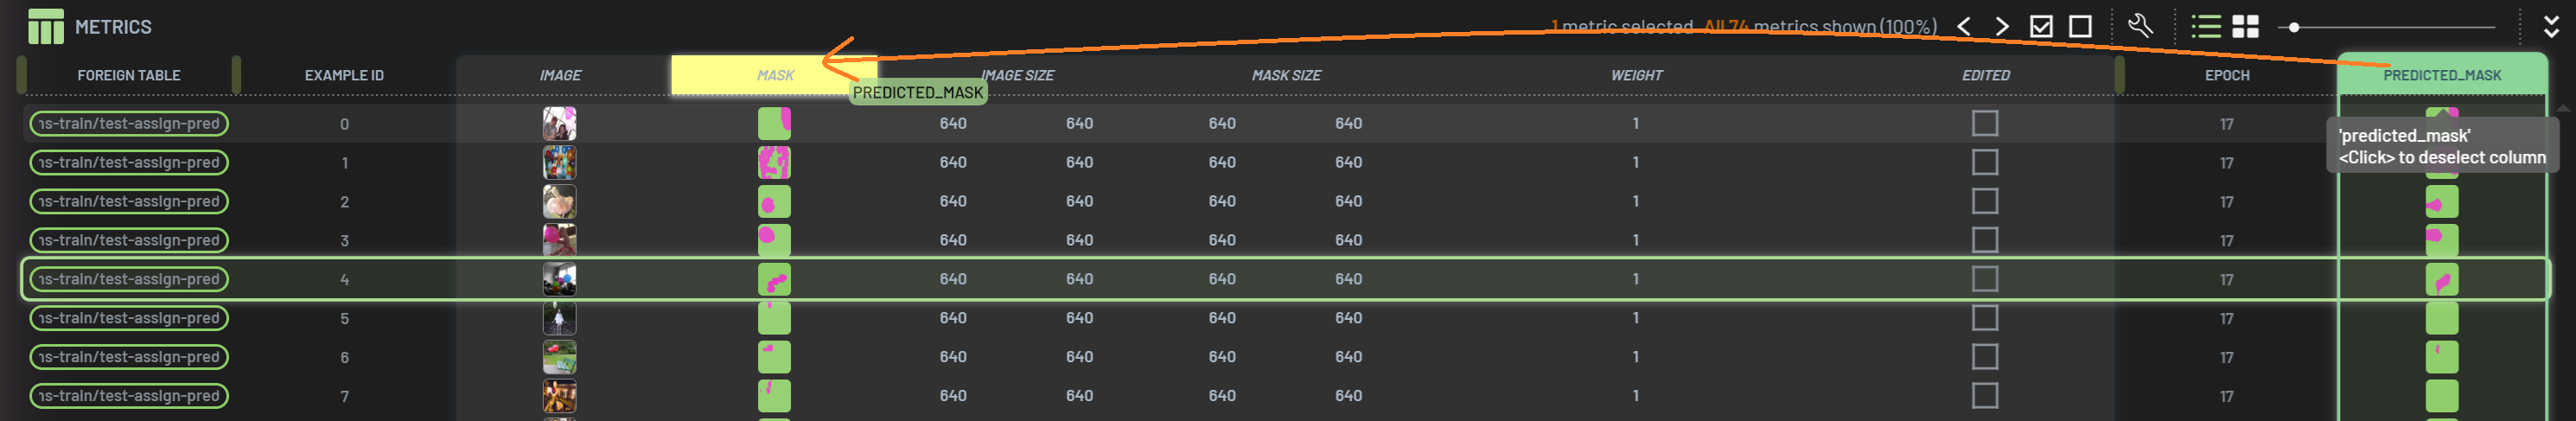
A set of virtual columns are created as shown in the orange box in the figure below. One of them is the BBs column named BBS_predicted_NMS0.25. Other columns are just associated attributes of the new set of BBs.
The 0.25 in the BBs column name represents the IOU threshold applied to derive the NMS-processed BBs. You can adjust
the IOU threshold under Tweak virtual column of this NMS-processed BBs column.
This new BBs virtual column can be used as if they are the predicted BBs for any operations such as converting these BBs to ground truth.
Workflows
Workflows help you automatically execute a series of steps to fulfill standard tasks. To learn the basics of 3LC Workflows, please read this page.
There are a number of handy workflows designed for BBs (and other types of object detection such as instance segmentations, pose/keypoints, etc). Some workflows are only for ground truth BBs or predicted BBs while others are for both together. Below is a list of all available workflows for BBs.
For ground truth and predicted BBs together:
Object detection basic insights tour
Show image and instances
Generate FN/FP/TP columns
Show Prediction vs. Ground truth matches
Inaccurate instance labels
Instance missing labels
Add new instance label categories
Per-instance confusion matrix
Precision (all & per class)
Recall (all & per class)
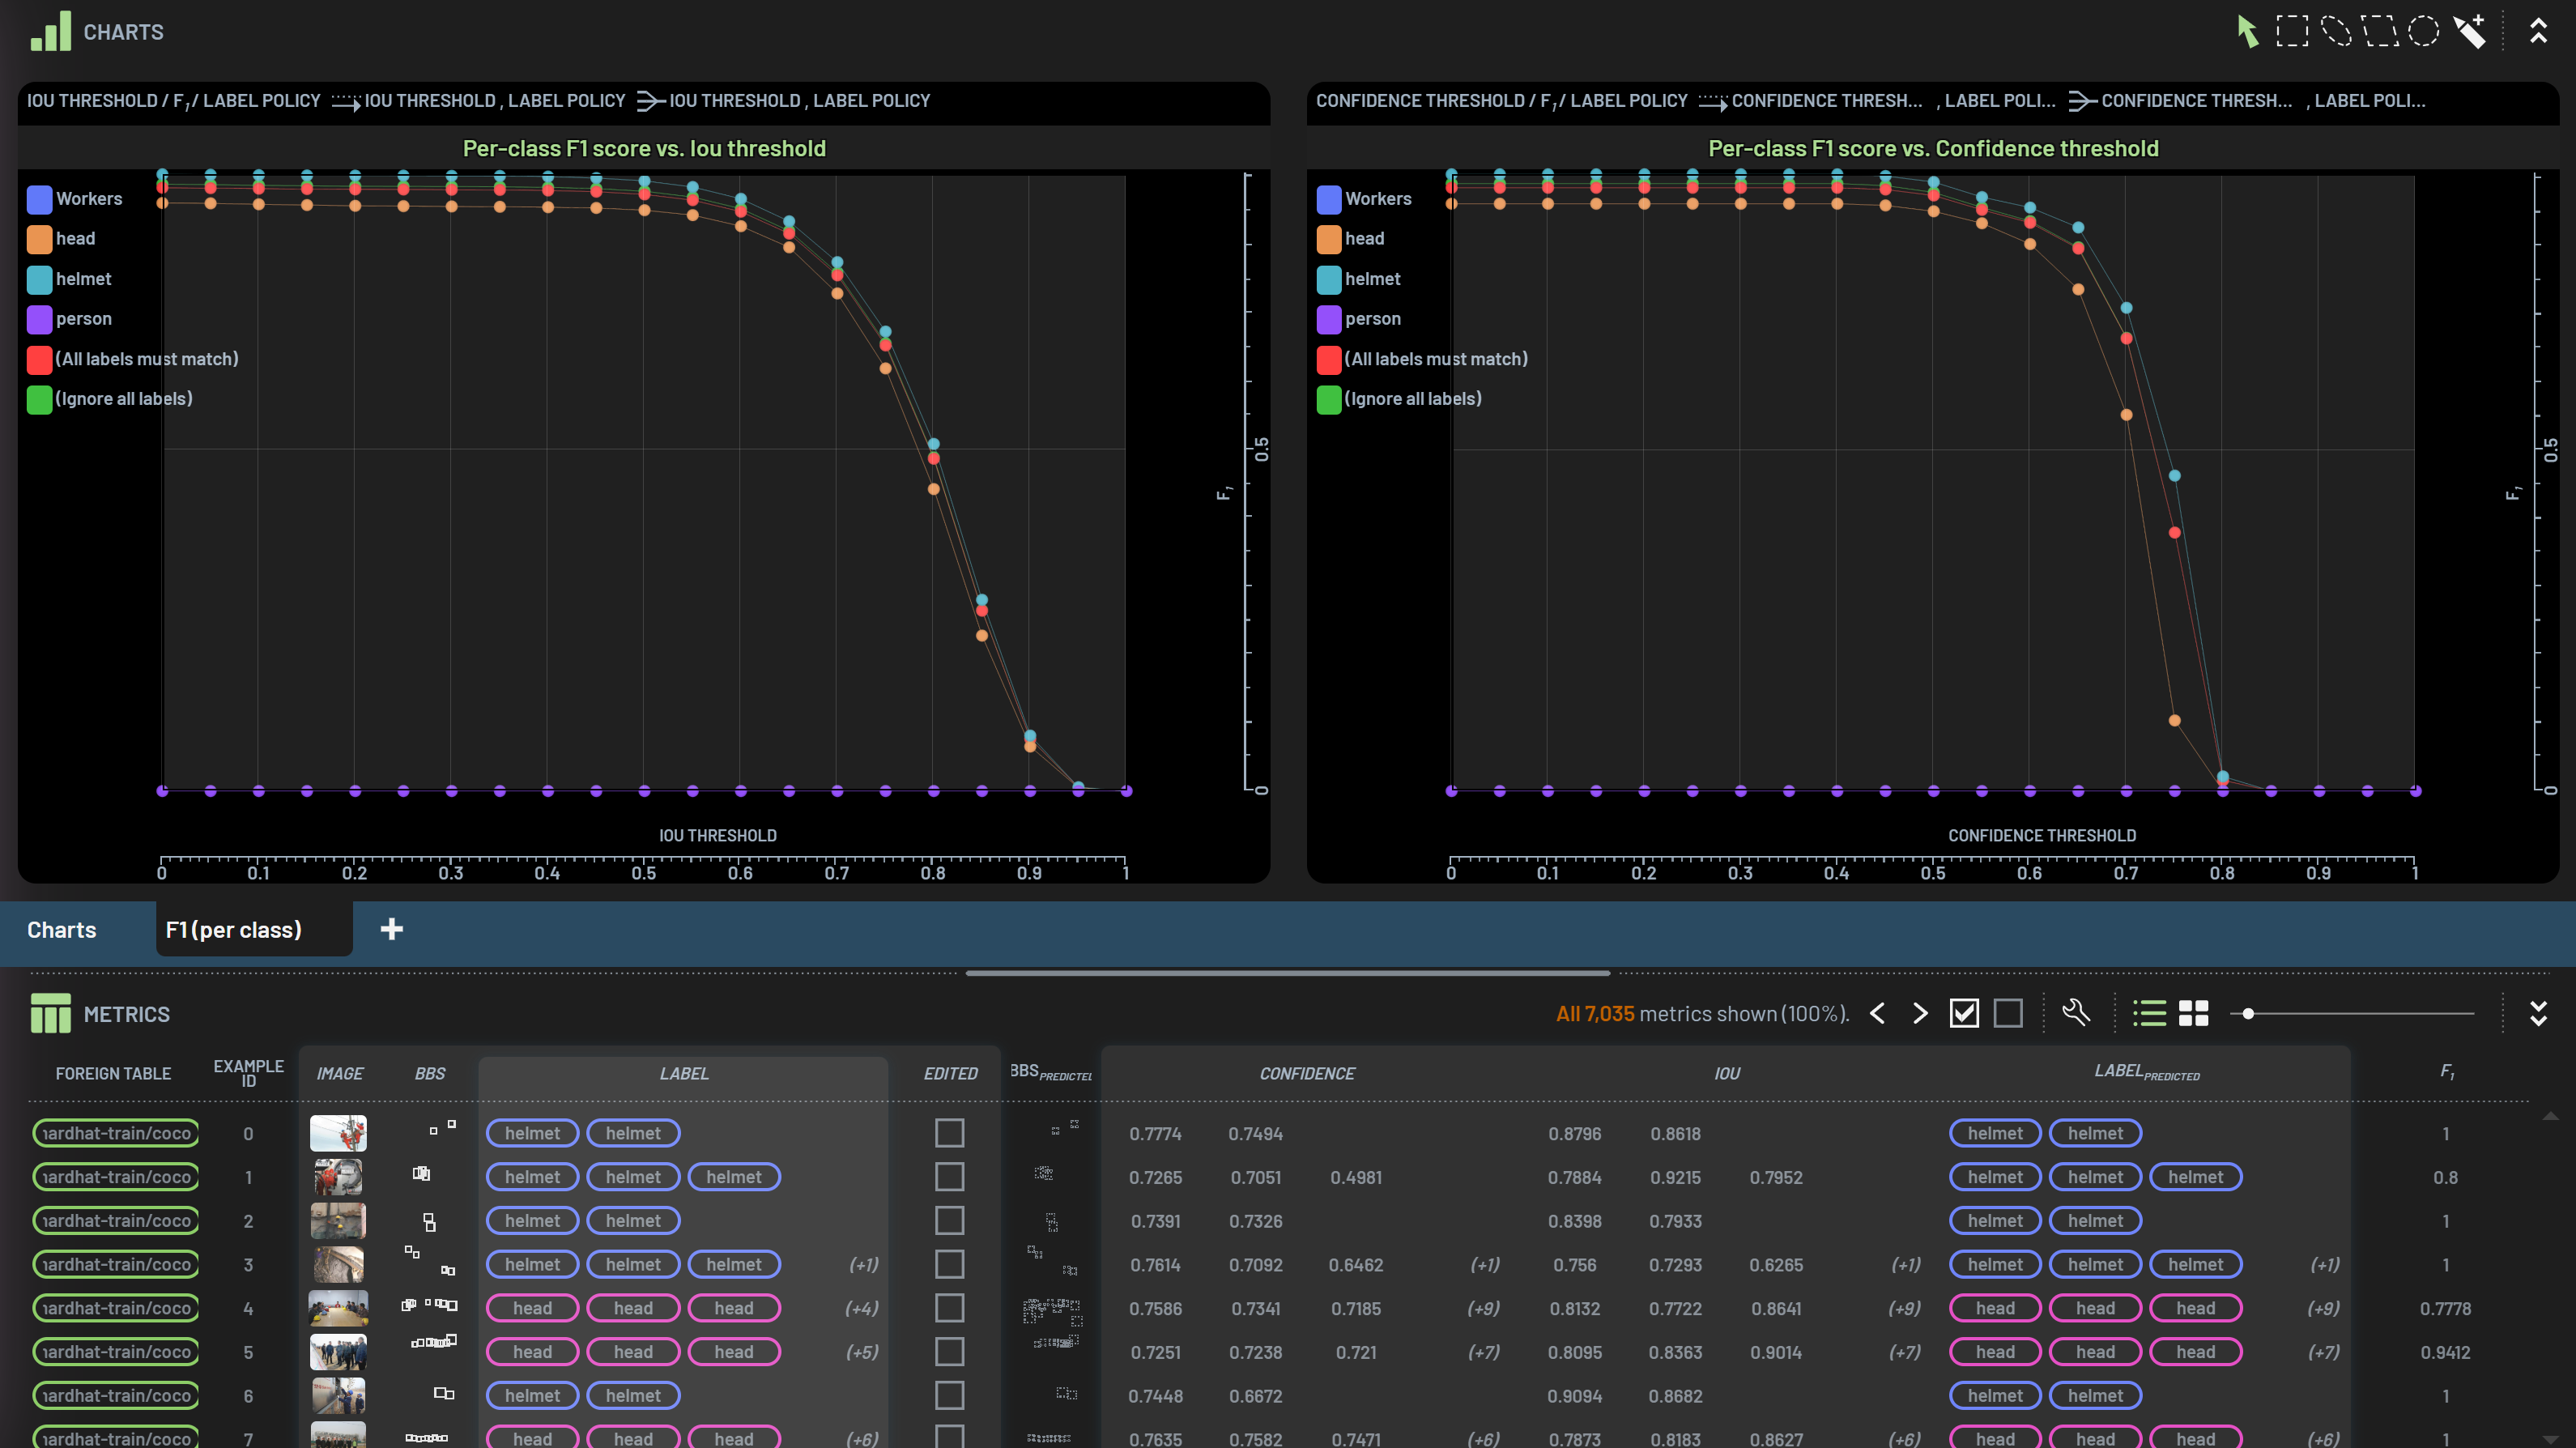
F1 (all & per class)
For ground truth BBs:
Properties of instances
Instance filters
Advanced instance filtering
For predicted BBs:
Non-Maximum Suppression (NMS)
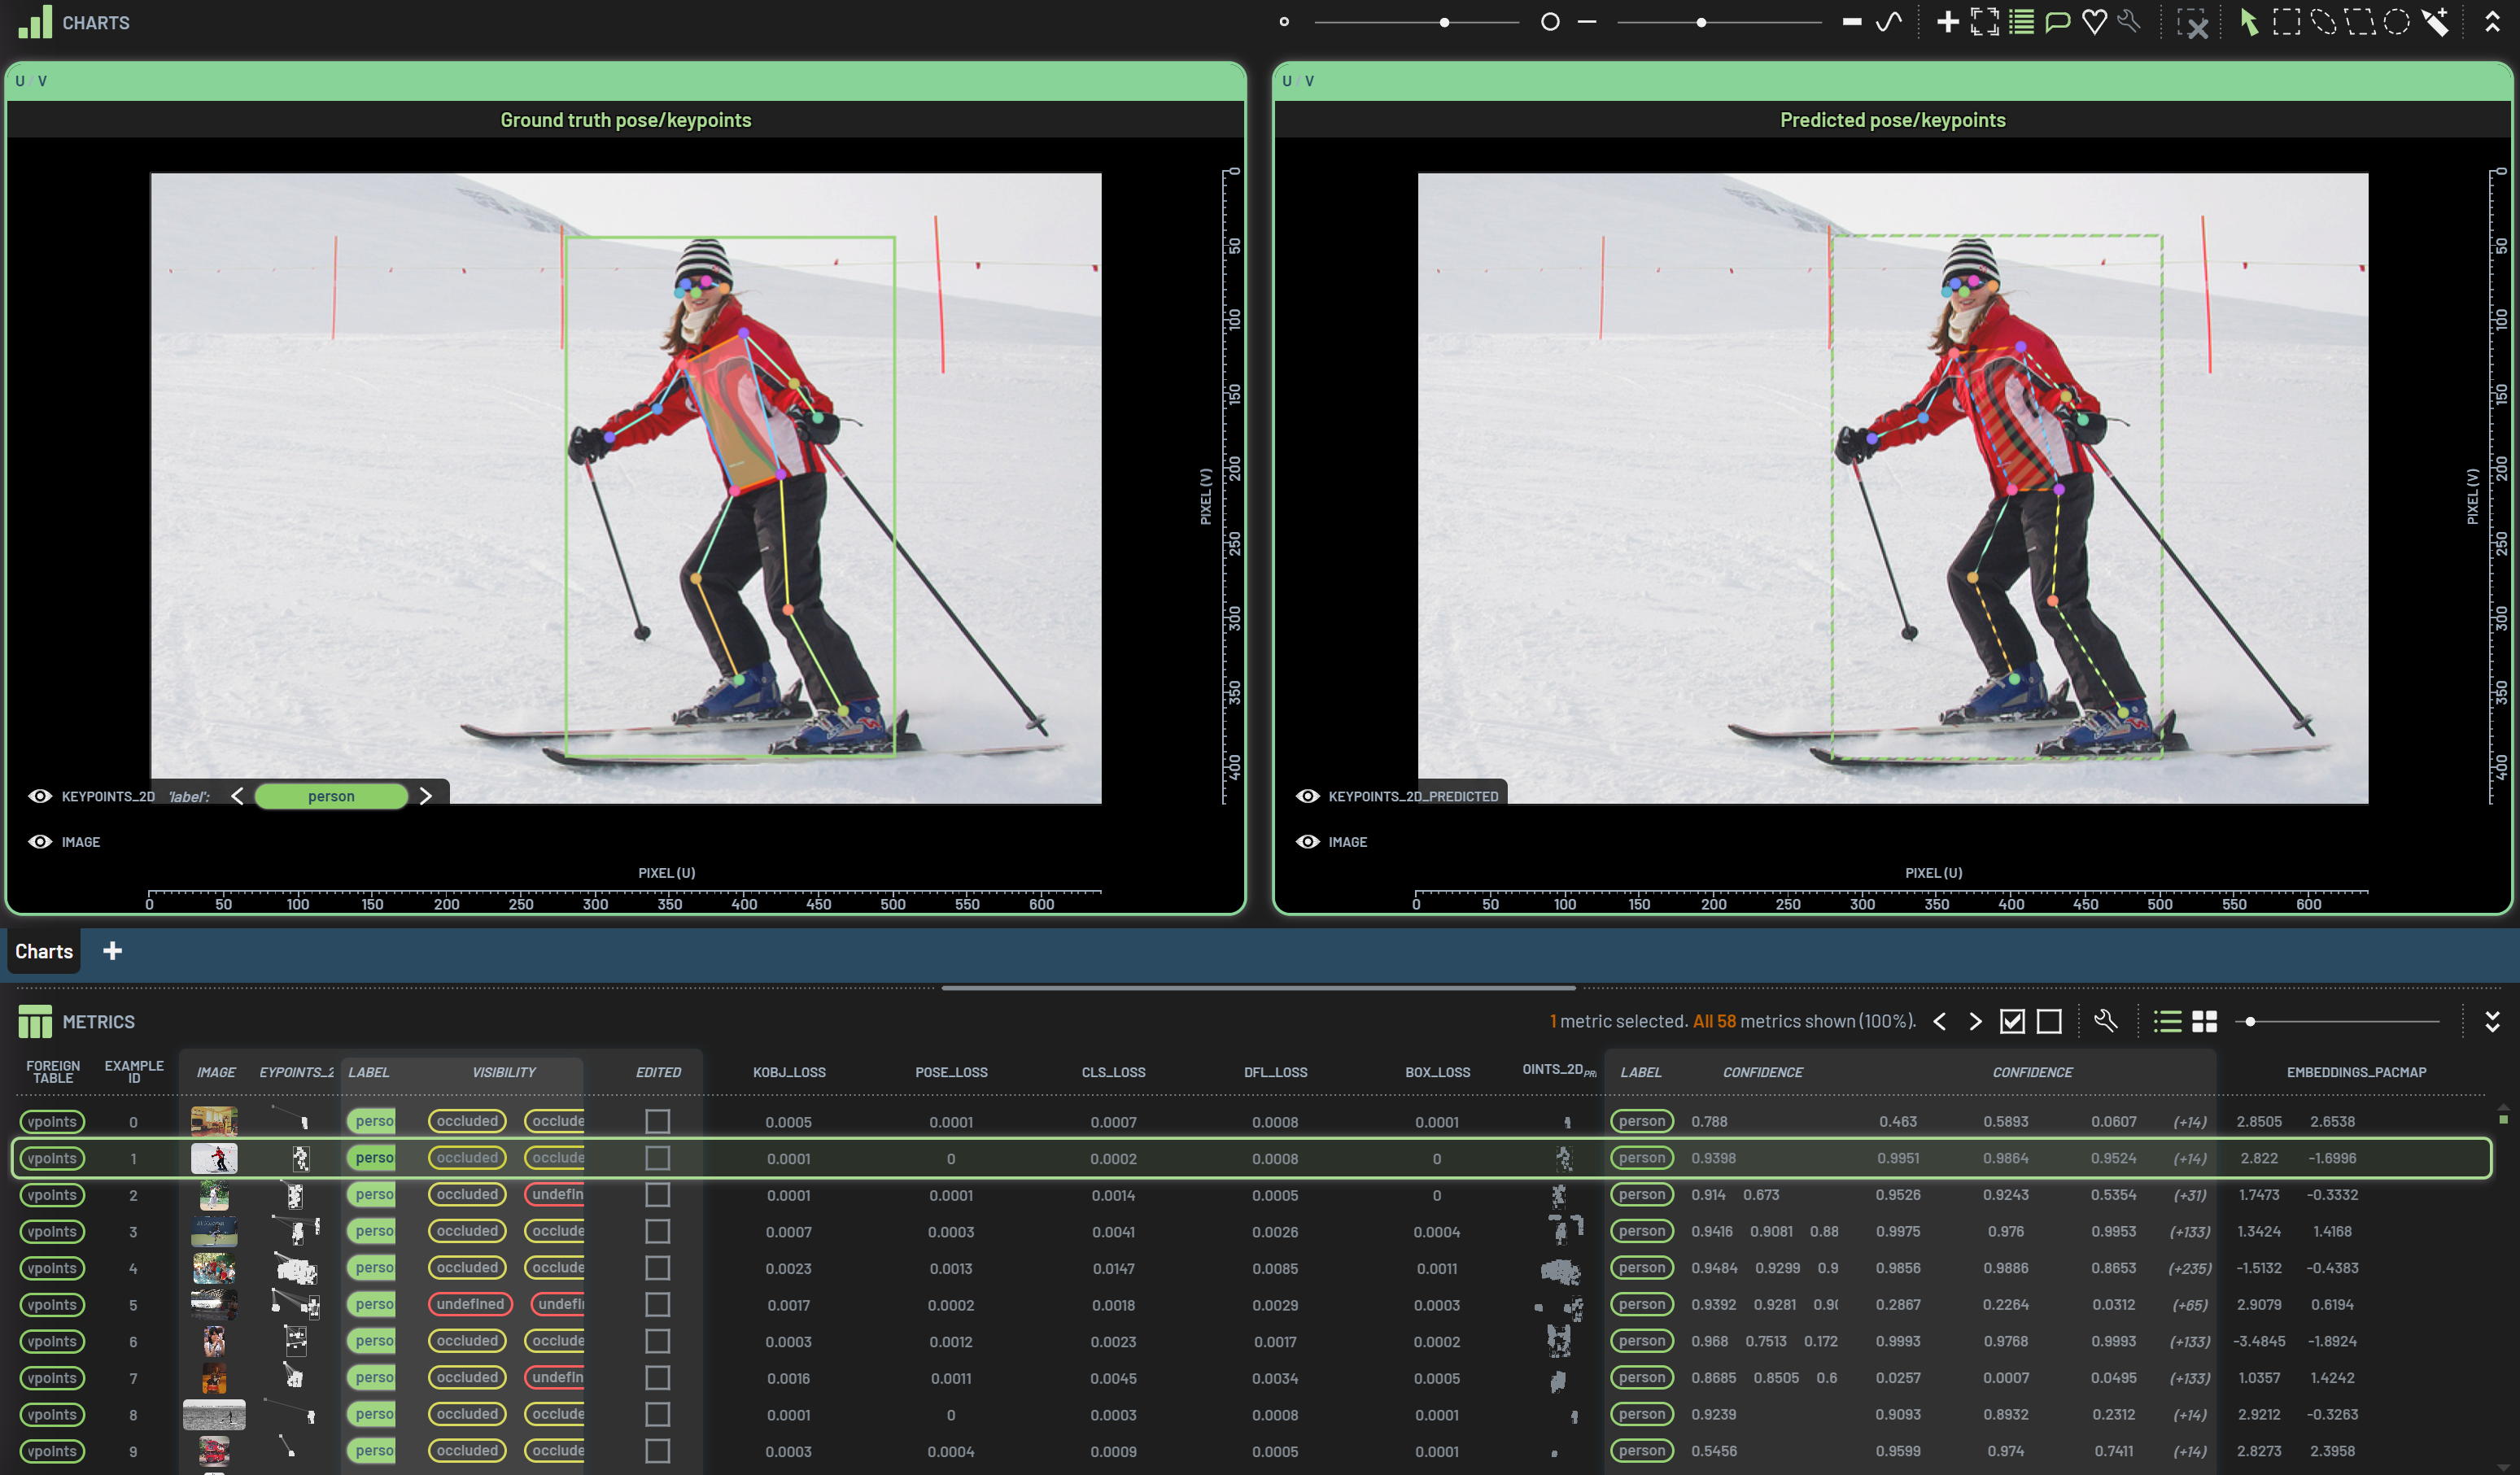
The screenshot below shows an example of running the per-class F1 workflow. An F1 column is derived, and two charts are created showing per-class F1 scores vs IoU (Confidence) threshold.