Per Bounding Box Luminosity Calculation
This notebook demonstrates how to calculate the luminosity of images and their bounding boxes and add them as columns to a Table.
We will write a new Table combining the columns of the input table with the calculated luminosity properties.
Project Setup
[ ]:
PROJECT_NAME = "3LC Tutorials - COCO128"
DATASET_NAME = "COCO128"
DATA_PATH = "../../data"
INSTALL_DEPENDENCIES = True
[ ]:
if INSTALL_DEPENDENCIES:
    %pip install -q 3lc
Imports
Set Up Input Table
We will use a TableFromCoco to load the input dataset from a annotations file and a folder of images.
[ ]:
annotations_file = tlc.Url(DATA_PATH + "/coco128/annotations.json").to_absolute()
images_dir = tlc.Url(DATA_PATH + "/coco128/images").to_absolute()

input_table = tlc.Table.from_coco(
    project_name=PROJECT_NAME,
    dataset_name=DATASET_NAME,
    table_name="initial-bbs",
    annotations_file=annotations_file,
    image_folder=images_dir,
    description="COCO 128 dataset",
)
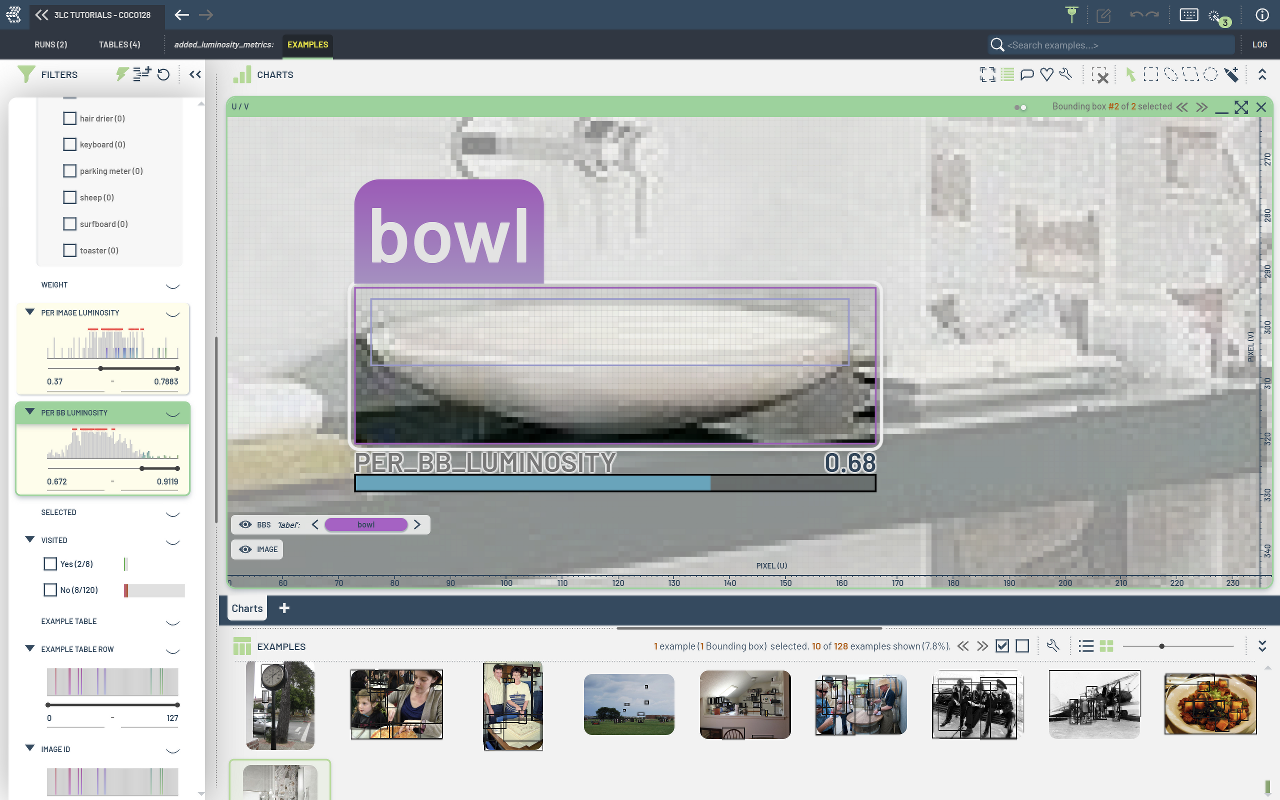
Calculate the Luminosity of Images and Bounding Boxes
In this section, we will calculate the luminosity property for each image as well as for each bounding box within the images.
We build the variables per_image_luminosity and per_bb_luminosity to store the luminosity properties for each image and bounding box, respectively.
[ ]:
[ ]:
per_bb_luminosity: list[list[float]] = []
per_image_luminosity: list[float] = []

for row in tqdm.tqdm(input_table, total=len(input_table), desc="Calculating luminosity"):
    image_filename = row["image"]
    bb2d = row["bbs"]  # BoundingBoxes2D object (sample view)

    image_bytes = tlc.Url(image_filename).read_bytes()
    image = Image.open(BytesIO(image_bytes))

    image_luminosity = calculate_luminosity(image)
    per_image_luminosity.append(image_luminosity)

    bb_luminosity_list: list[float] = []

    for i in range(bb2d.num_instances):
        # Crop image to bounding box (absolute XYXY)
        x_min, y_min, x_max, y_max = bb2d.bounding_boxes[i]
        bb_crop = image.crop((int(x_min), int(y_min), int(x_max), int(y_max)))
        bb_luminosity = calculate_luminosity(bb_crop)
        bb_luminosity_list.append(bb_luminosity)

    per_bb_luminosity.append(bb_luminosity_list)
Create new Table containing luminosity properties
After calculating the luminosity, we will create a new table using a TableWriter.
Setup the Schema of the output Table
[ ]:
# Each entry in the list is a list of luminosity values for each bounding box in the image
per_bb_luminosity_schema = tlc.schemas.FractionSchema(
    shape=(-1,),
    sample_type="hidden",
    writable=False,
)

per_image_luminosity_schema = tlc.schemas.FractionSchema(
    sample_type="hidden",
    writable=False,
)

schemas = {
    "per_bb_luminosity": per_bb_luminosity_schema,
    "per_image_luminosity": per_image_luminosity_schema,
}
schemas.update(input_table.rows_schema.values)  # Copy over the schema from the input table
Write the output Table
We will use a TableWriter to write the output table as a TableFromParquet.
[ ]:
from collections import defaultdict

table_writer = tlc.TableWriter(
    project_name=PROJECT_NAME,
    dataset_name=DATASET_NAME,
    description="Table with added per-bb luminosity metrics",
    table_name="added_luminosity_metrics",
    schema=schemas,
    if_exists="rename",
    input_tables=[input_table.url],
)

# TableWriter accepts data as a dictionary of column names to lists
data = defaultdict(list)

# Copy over all rows from the input table
for row in input_table.table_rows:
    for column_name, column_value in row.items():
        data[column_name].append(column_value)

# Add the luminosity metrics
data["per_image_luminosity"] = per_image_luminosity
data["per_bb_luminosity"] = per_bb_luminosity

table_writer.add_batch(data)
new_table = table_writer.finalize()
Inspect the properties of the output Table
[ ]:
Let’s check which columns are present in the sample view / table view of the input and output tables:
[ ]:
# Sample view of input table
input_table[0].keys()
[ ]:
# Table view of input table
input_table.table_rows[0].keys()
[ ]:
# Sample view of output table (does not contain the luminosity columns due to the sample_type="hidden" flag)
new_table[0].keys()
[ ]:
# Table view of output table (contains the luminosity columns)
new_table.table_rows[0].keys()