3LC Dashboard Version 2.8
2.8.8
Features
[18688] Added an Expression operation that combines columns with a typed formula, such as
sqrt(x^2 + y^2)orx > 0 ? x : 0.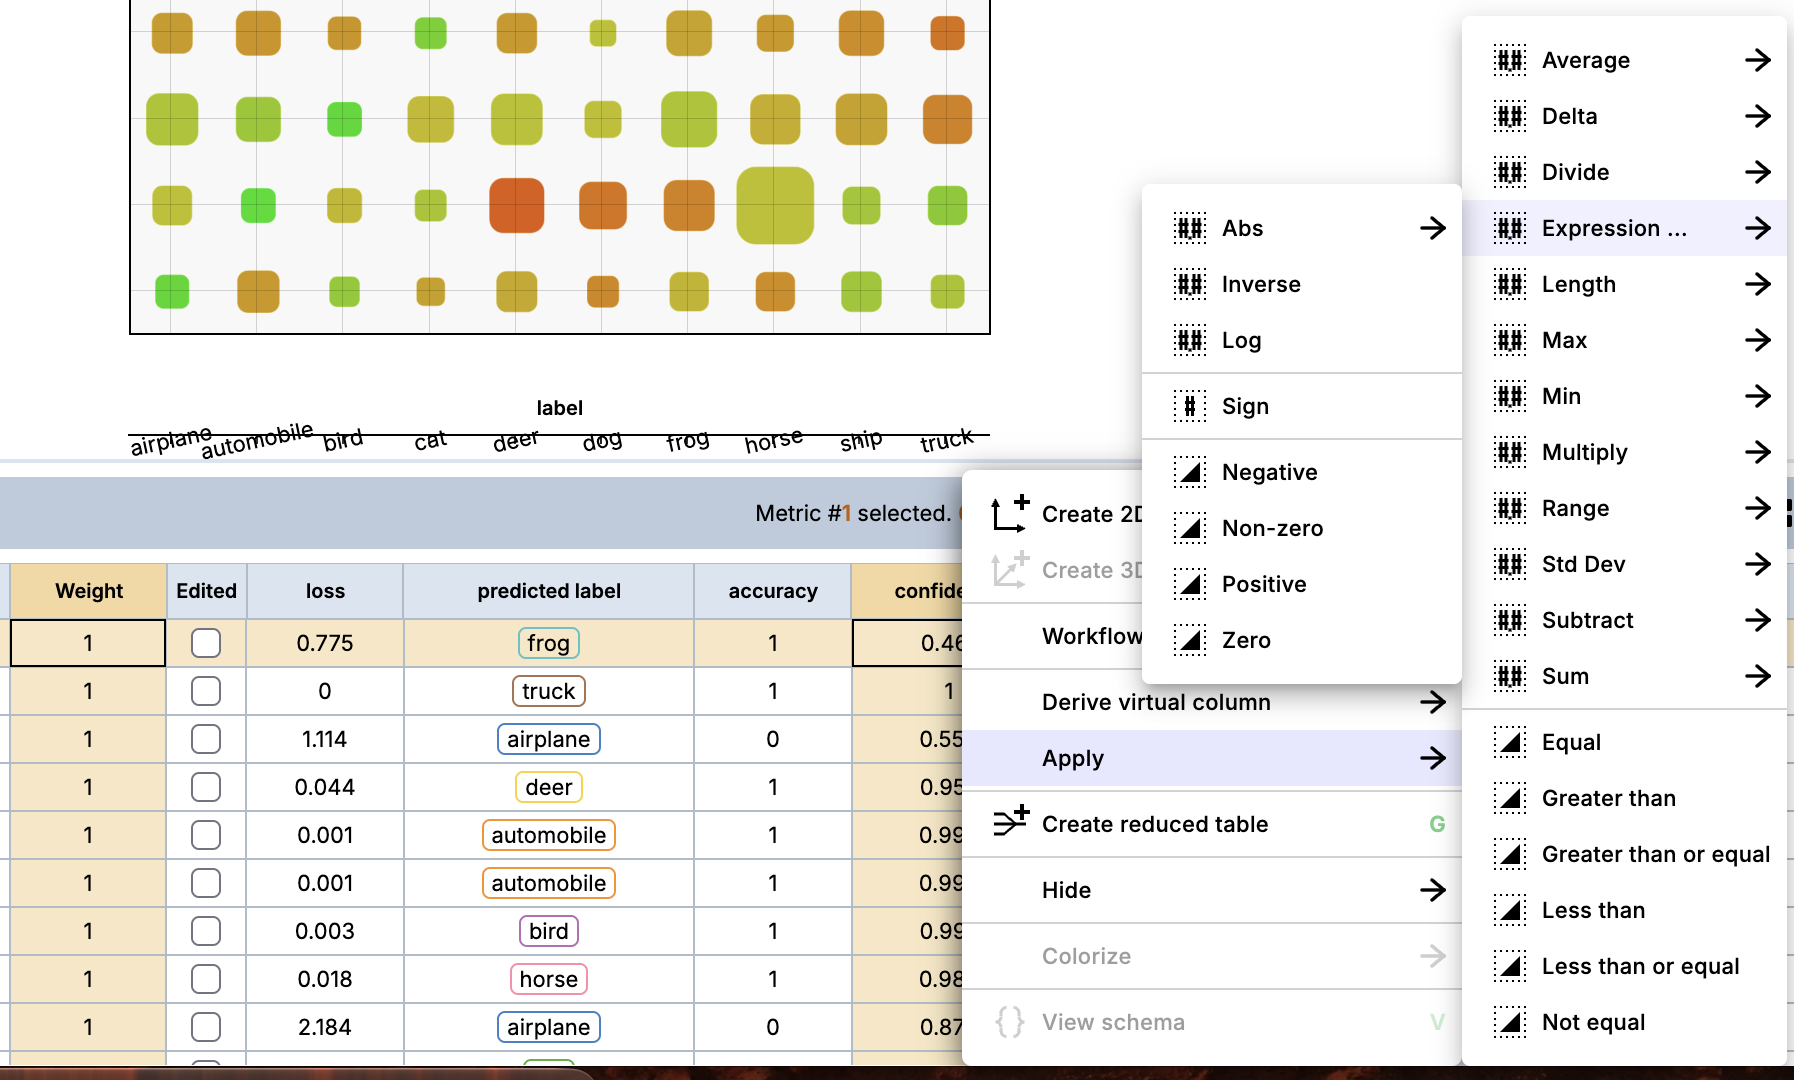
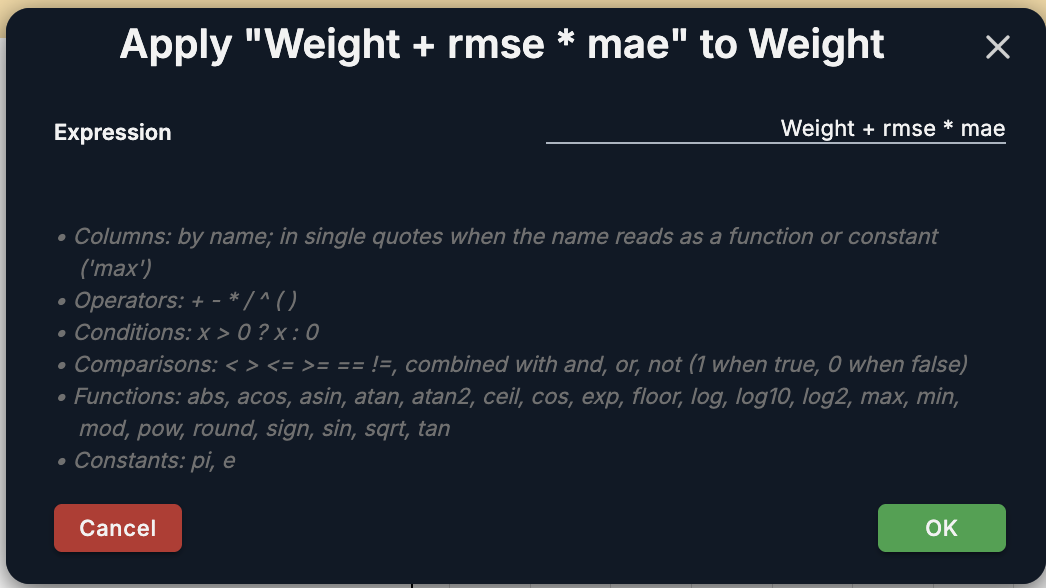
[18682] [12963] Added Apply to a writable column’s context menu. It offers the same operations as Derive virtual column, but applies the result onto the column itself for every filtered-in row, as pending edits. Operations with parameters open a dialog that re-applies on every change, so the result can be seen while tuning.
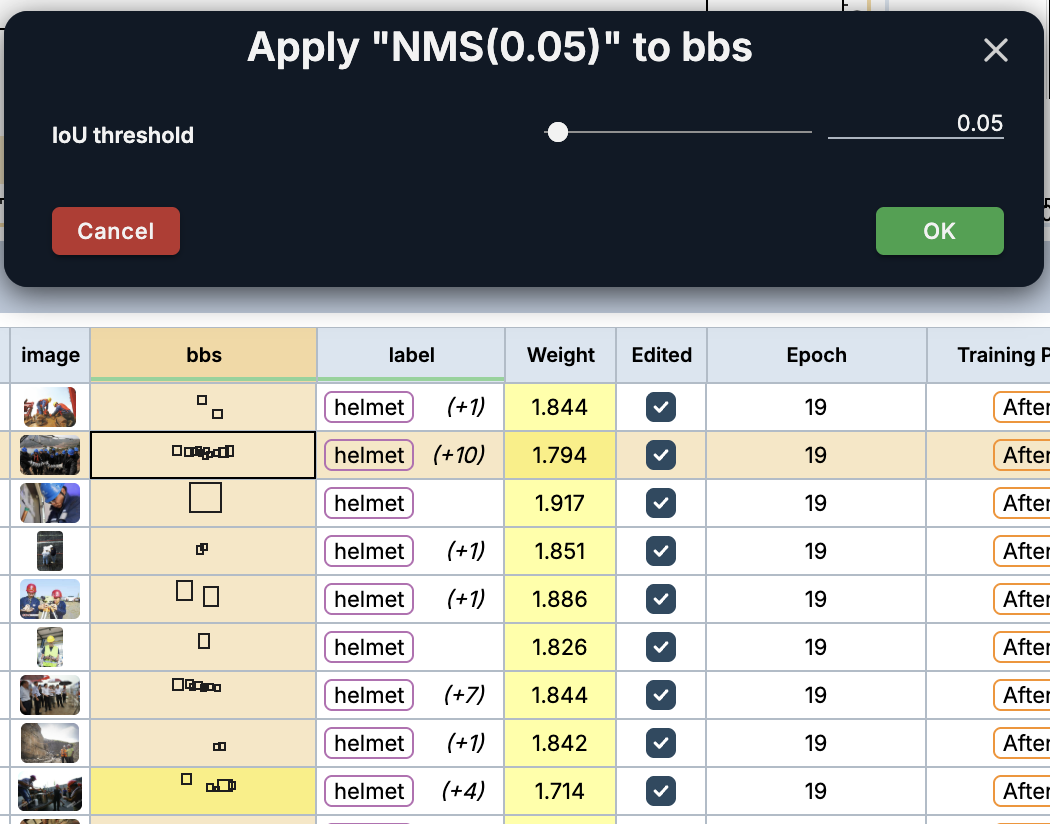
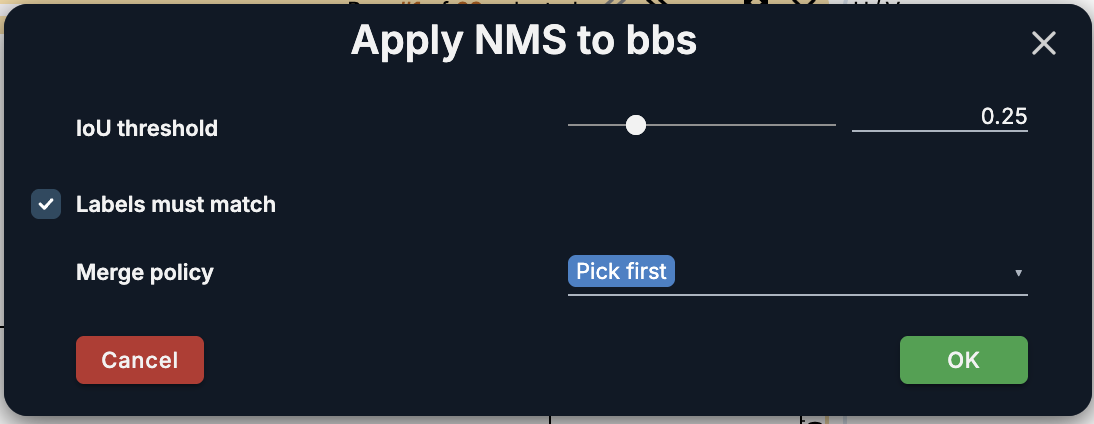
[18711] The NMS operation is now called Merge overlapping (NMS) and can merge overlapping boxes or segmentation layers by different policies. Choose Pick first (the previous behavior), Union, Intersection, Average, or the highest, lowest or weighted-average value of a numeric column such as confidence. By default, overlaps are only merged when their labels match. The operation also works on boxes without a confidence, such as ground truth, ranked by list order.
[18856] Added a Max column operation. For two or more numerical columns, each row names the column holding its largest value. Max column (element-wise) answers the same per element, such as per predicted box.
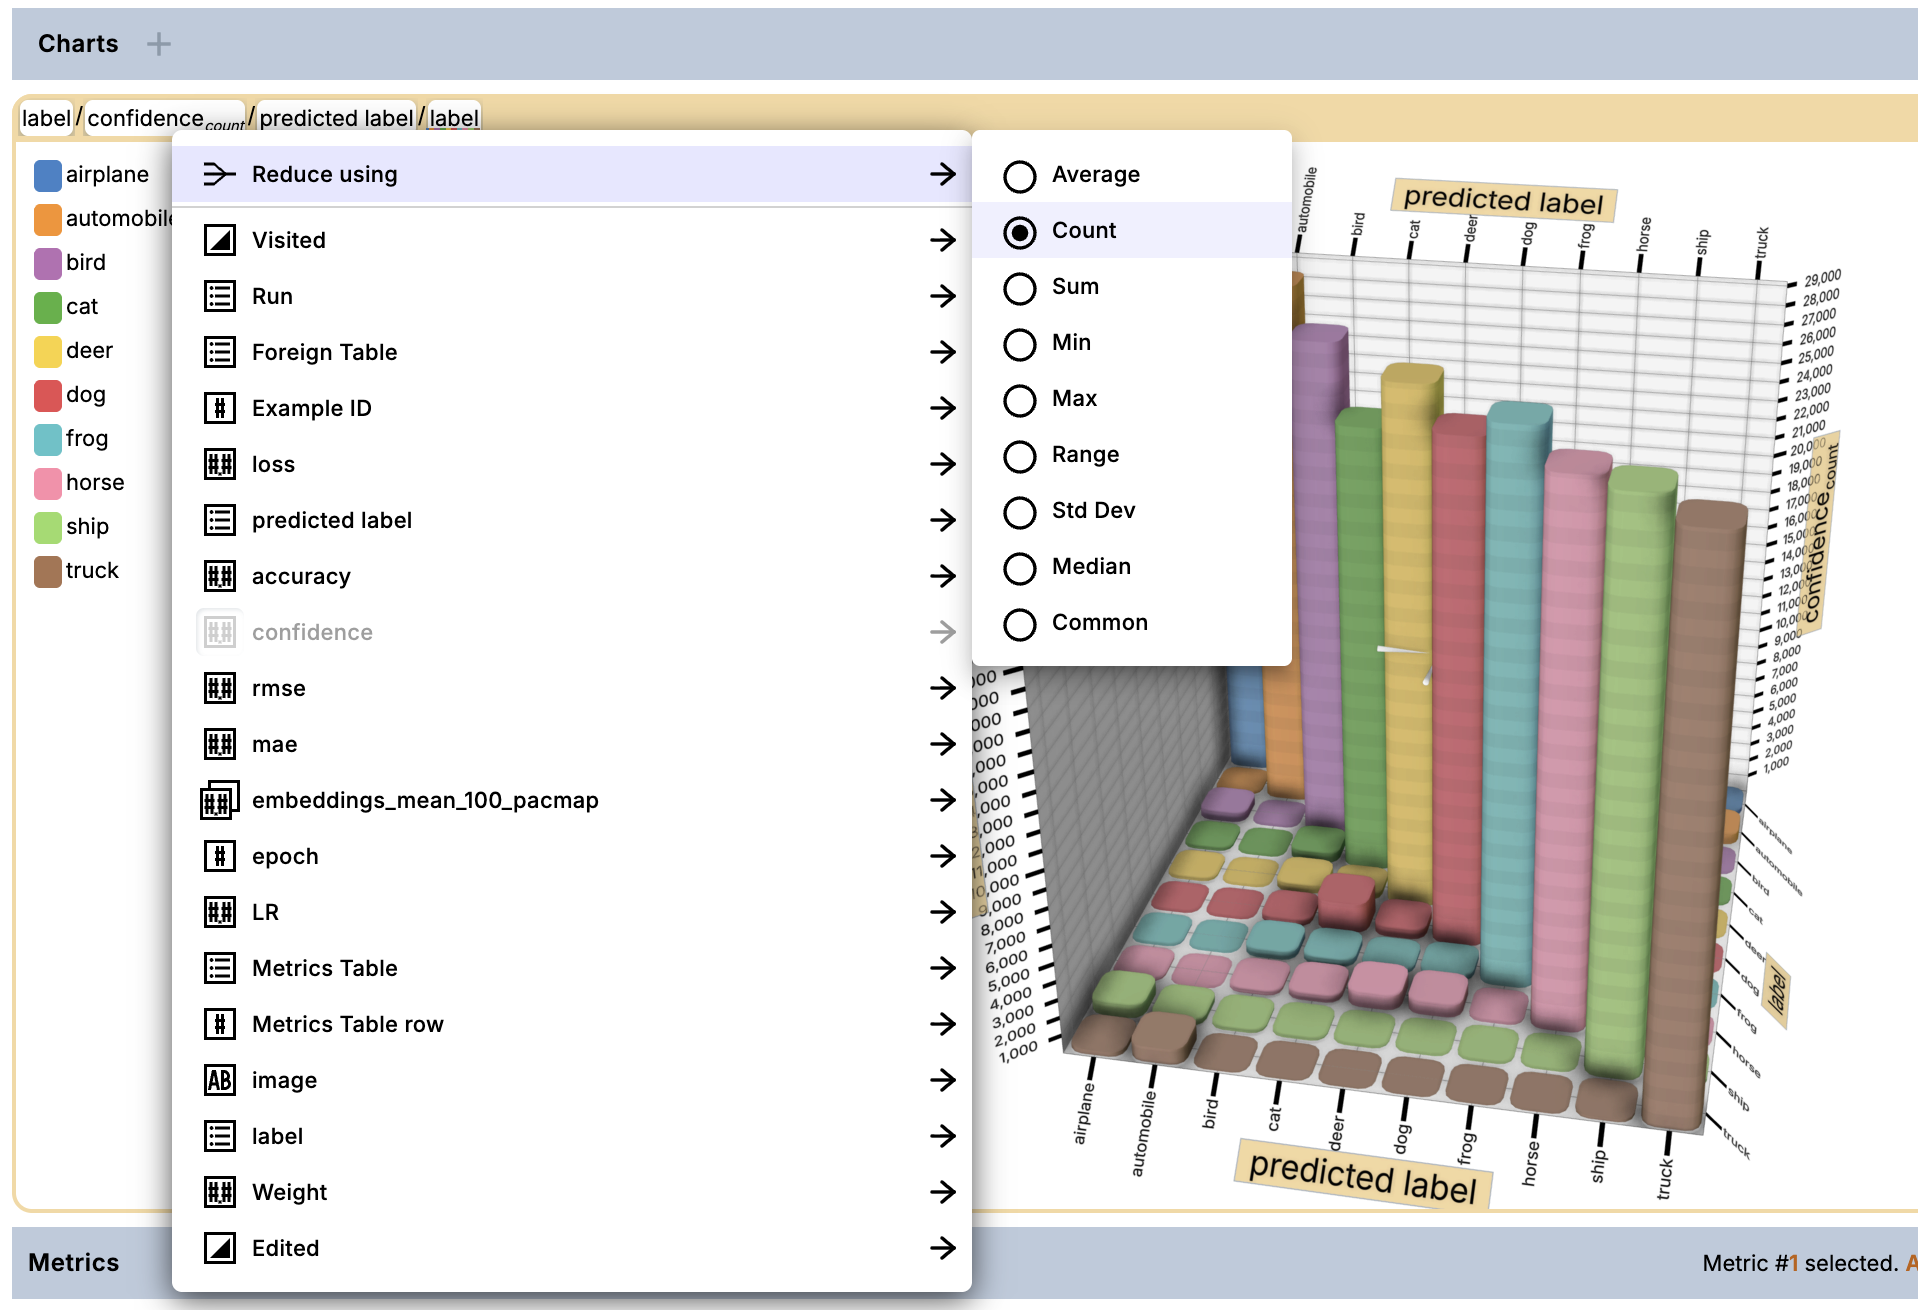
[13700] [18816] Reduced charts are no longer limited to averaging. Each axis can use another reduce operation, such as Count, Sum, Median or Standard deviation. Pick it from Reduce using in the axis menu, or switch every reduced axis at once from the new reduce button in the charts toolbar. Box and Voronoi charts are always available and reduce entries that share a floor position. Saved charts and workflows keep averaging.
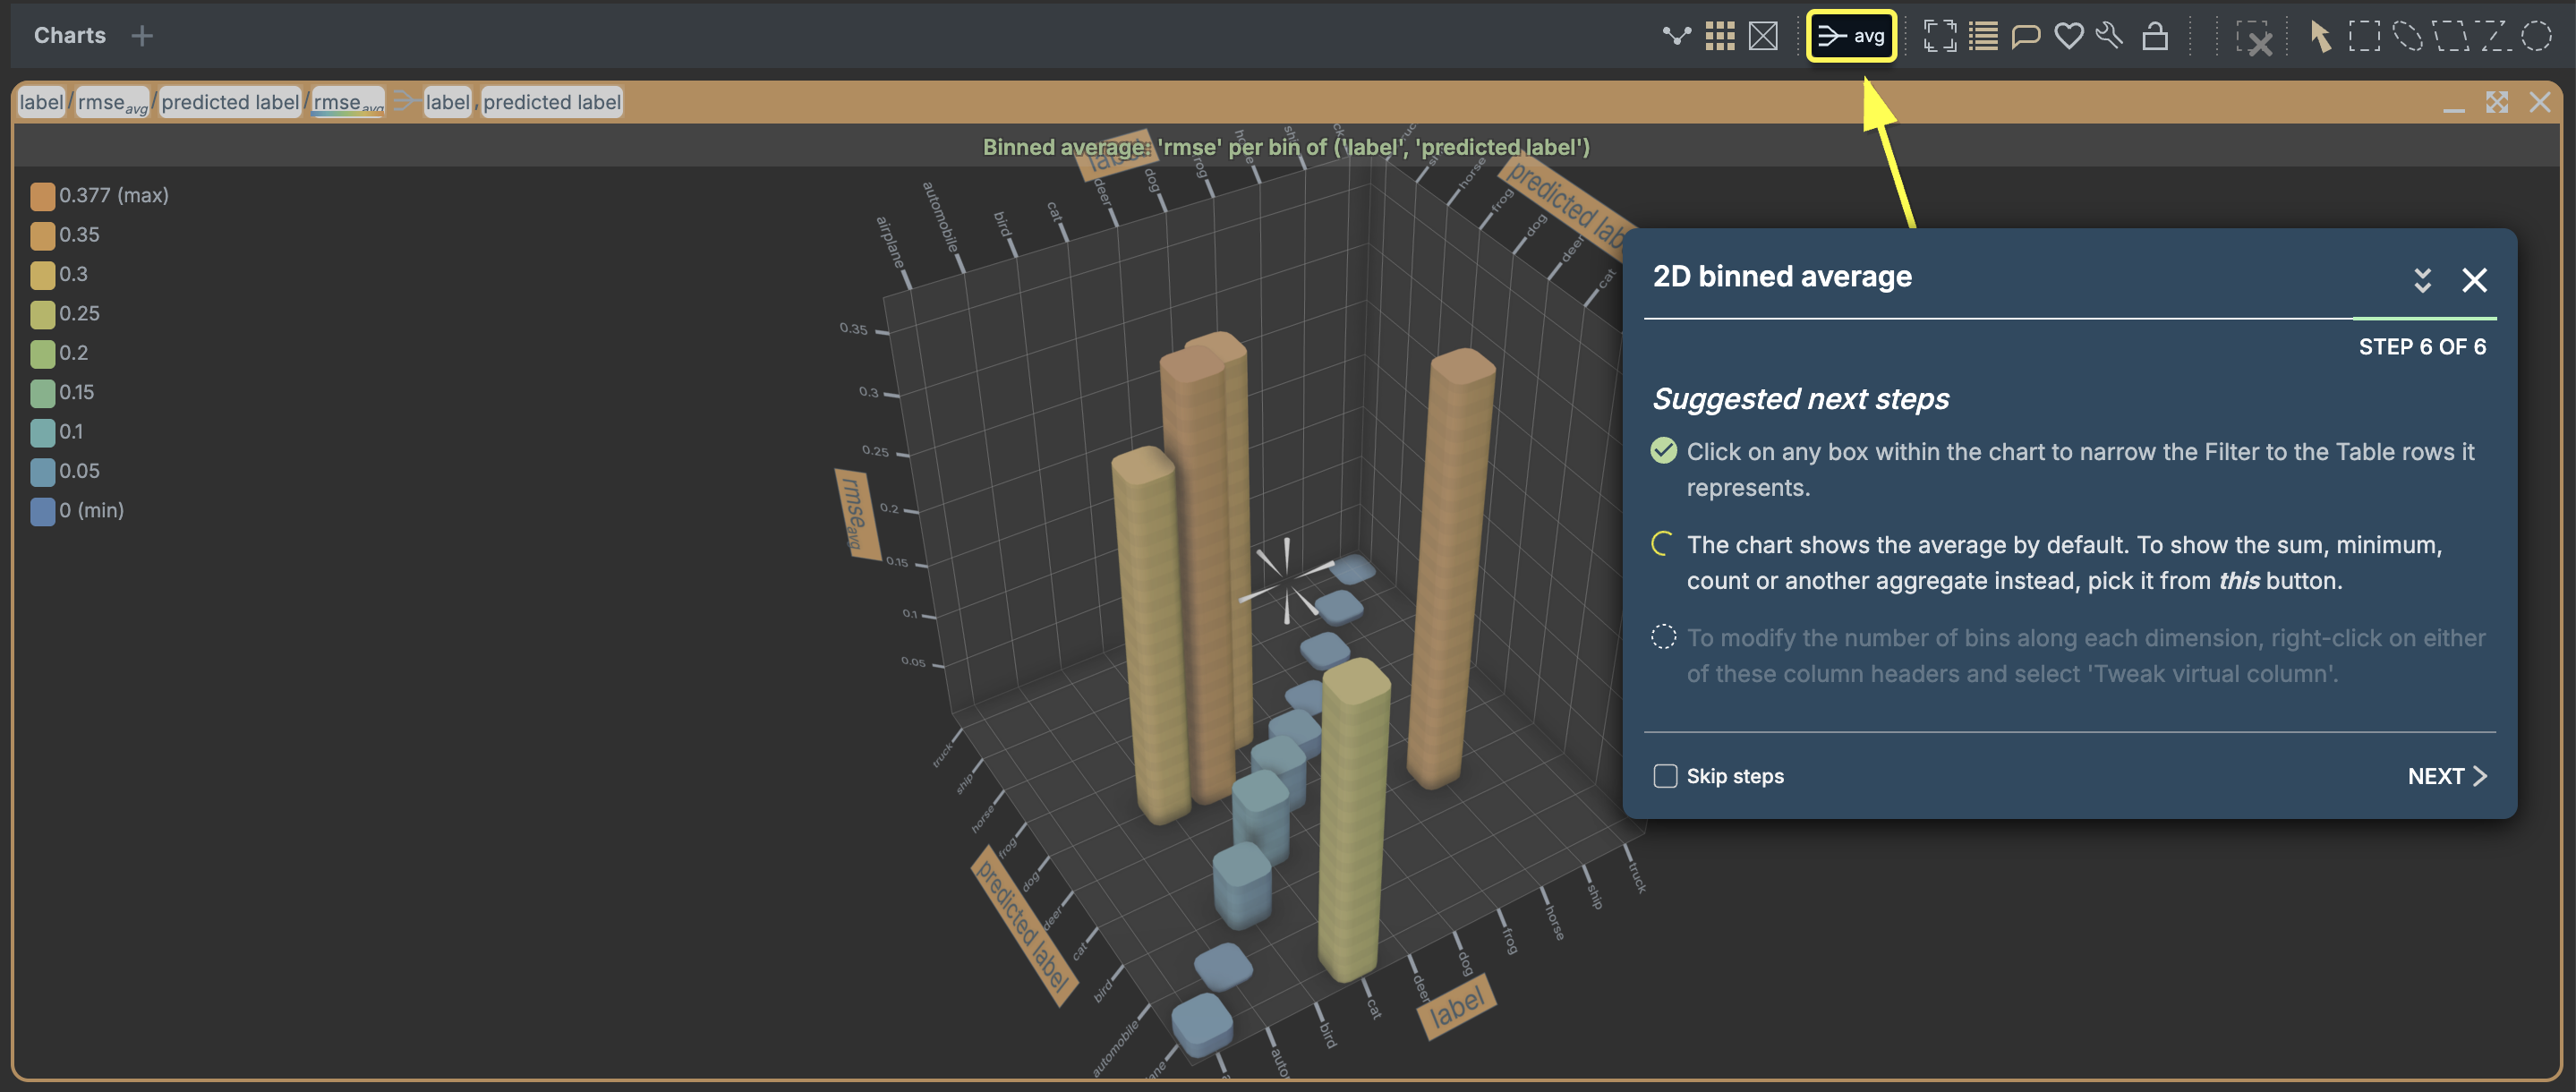
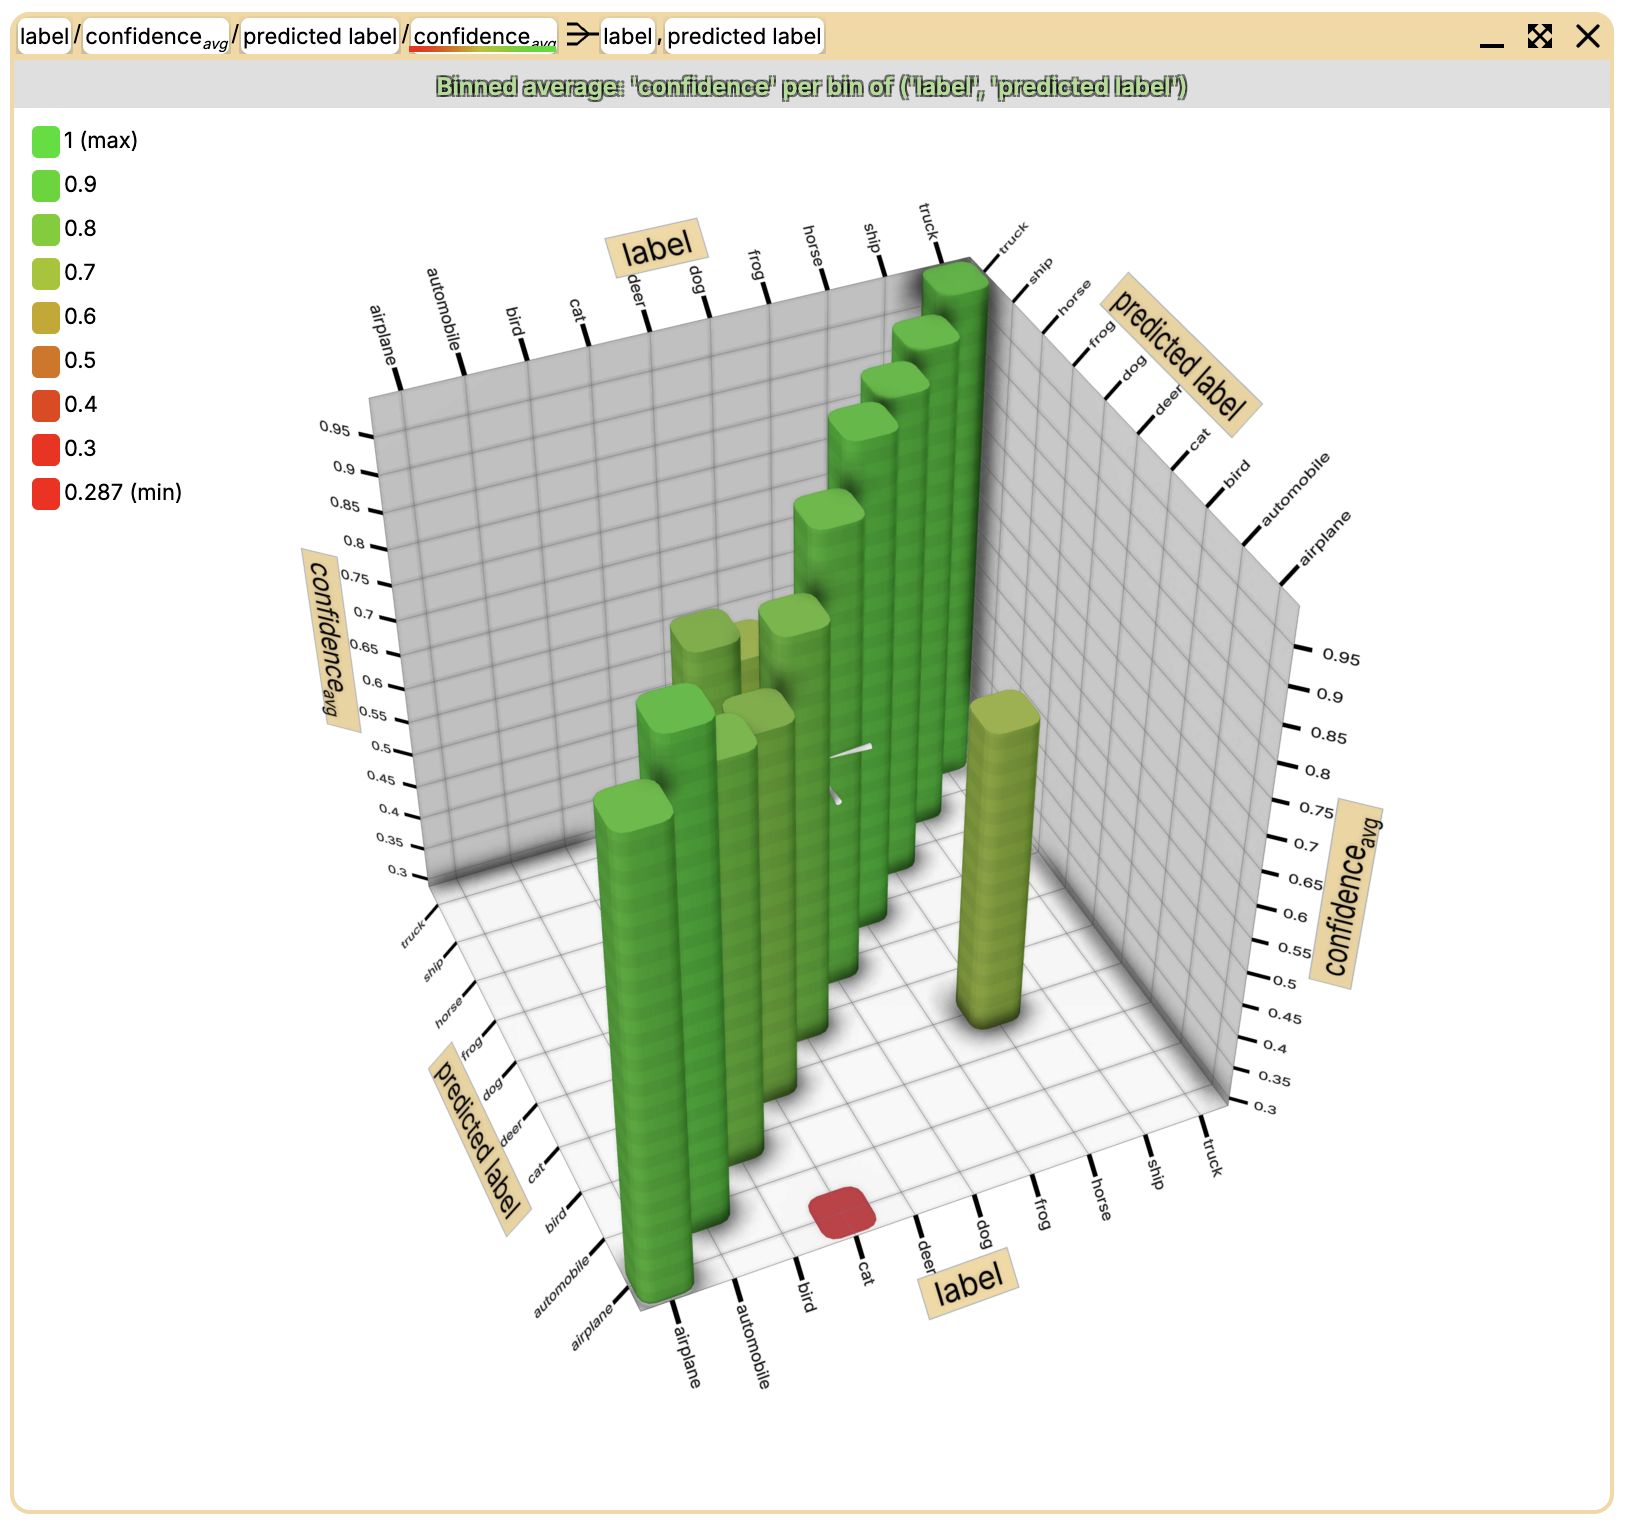
[15551] Added the Binned average and 2D binned average workflows, which show how a numeric column behaves across bins of one or two other columns. They draw a bar per bin in 2D and a pillar per cell in 3D. Right-click the vertical axis to switch to another aggregate.
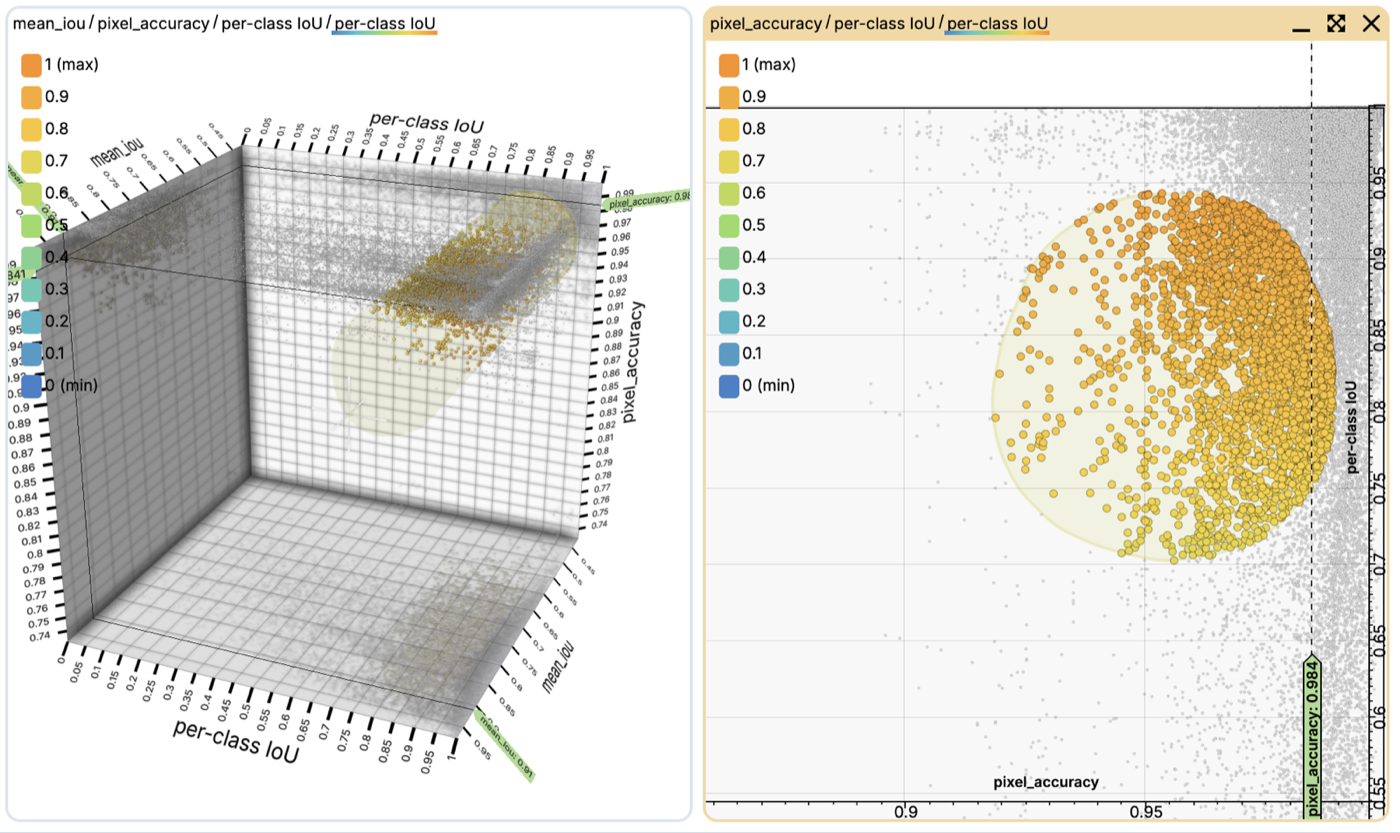
[18686] Charts now show the region each filter keeps. 2D charts draw it as a filled and outlined area under the data, and 3D charts draw it on the box walls. The range sliders in the Filters panel use the same colors. Two chart settings turn the 2D and 3D regions off.
[14502] Added Create 2D chart image column and Create 3D chart image column to a chart’s title menu. The new column shows, for each row, a thumbnail of the chart as if only that row were selected. Charts show the column as an image.
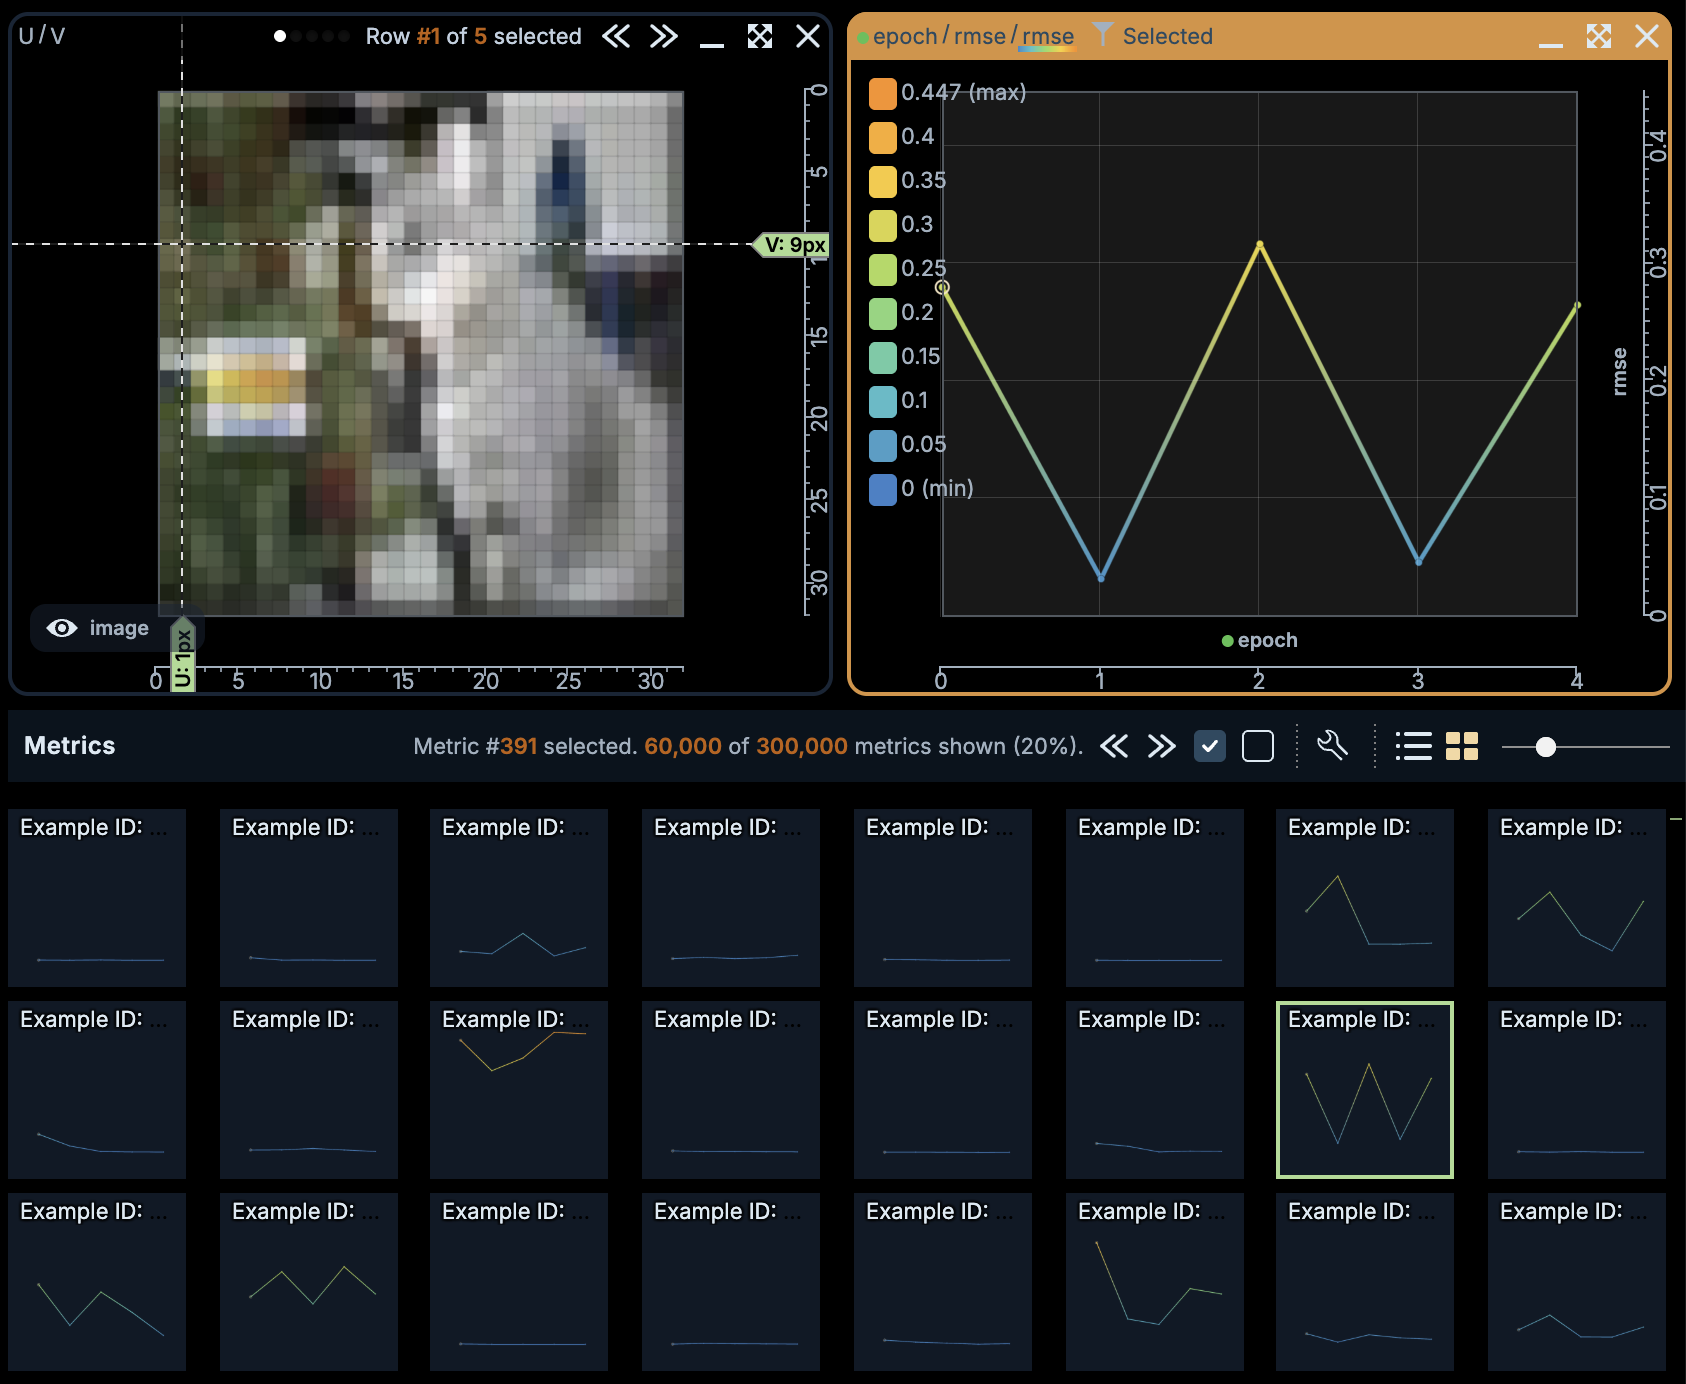
[18914] [18936] Added an Expression image operation. It computes an image per row, pixel by pixel, from the row’s image, mask and number columns, with one expression per channel. Expression images behave like any other image and can be used as input to another Expression image.
[18907] [18928] Brightness and Contrast on chart images are replaced by Levels, which stretches a range of pixel values over the full display range. Auto levels picks the range from the histogram of each image. 16-bit PNG images now keep their 16 bits in charts, so narrow ranges show smooth gradients instead of bands.
[18936] [18966] Hovering an image in a 2D chart can now show the pixel value under the pointer. The readout is off by default. Set “Pixel readout” to fractions or integers to turn it on.
[18930] Charts now keep their camera when stepping between rows whose images have the same aspect ratio. Control this with the new settings “Snap to contents when image changes” and “Snap when changing table row”.
[9386] Bounding-box outlines and multi-layer mask thumbnails in the Table panel are now colored by the same column as in charts, typically the label. The column header offers Colorize by to pick another column or turn coloring off, and the choice is remembered per column name.
[18716] Read-only columns that hold the same value in every row are now hidden in the Table panel by default, and a popup names what was hidden. Use the column menu to bring hidden columns back, and the setting “Hide read-only single-valued columns” to turn the behavior off.
[18842] The setting toggles and workflow shortcuts that were disabled because Ctrl + Shift collided with browser and OS shortcuts are back on Alt + Shift (Option + Shift on macOS). For example, Alt + Shift + J toggles chart grid lines, and Alt + Shift + 1 to Alt + Shift + 6 start workflows. Alt + Shift + D also toggles dark mode.
Enhancements and Fixes
[18854] Hovering a chart point now highlights its whole row, as hovering a Table panel row does. Other charts, legends, color bars and filter histograms mark that row’s exact values.
[18753] Location labels for Projects, Runs and Tables now keep the start and end of the URL, so S3 locations with the same folder name in different buckets can be told apart. Hovering a shortened label shows the full URL.
[18754] Searching Settings for a section heading now shows the whole section, and search words may be split between a section and a setting in it.
[18759] The Dashboard now picks up changes to the Object Service’s configuration, such as new aliases, without a page refresh.
[18645] Clicking a box in the semantic segmentation confusion matrix and Forgetting Events charts now keeps the other boxes in view, greyed. In every box chart, greyed boxes keep their full size after a click.
[18650] The Tweak selected charts dialog now disables the cells that have no effect, such as color and size before a chart has its axes, and explains why on hover.
[18605] Hovering a segmentation layer now lists the clicks available there, such as select, accept and delete. Layers of a semantic segmentation without a background can no longer be deleted.
[18719] After dragging a bounding box that overlaps another, the next click at that spot acts on the dragged box. Reaching a box’s edge brings that box to the front, so an edge inside a larger box can be grabbed.
[18861] Extend world lines now works on tables without an
example_idcolumn, and is disabled where it has no effect.[18688] Apply and dragging a column onto another now refuse writes that would damage the target column, such as values its value map does not know.
[18447] Double-clicking a Run or Table while edits are pending now opens its Metrics or Examples tab once the warning is confirmed.
[18907] Double-clicking between the handles of a range slider now resets it to the full range.
[18930] [18905] Charts now keep their camera when left idle or after a WebGL context loss, and no longer stay blank after a GPU process crash.
[18965] Fixed a new chart opening zoomed the way the last chart of the same columns was left, even in another project. New charts now open framed on their contents, and 3D charts keep their zoom when switching chart tabs.
[18902] Fixed images not showing in charts when their URL uses an alias with a relative value, such as
../../data.[18817] Fixed clicking a bar in a reduced 2D box chart, such as average loss per epoch, filtering out every row.
[18853] Fixed the smallest bar missing from bar charts of a count, sum, range or standard deviation, which now start at 0.
[18814] Fixed the per-instance confusion matrix workflow being offered for semantic segmentation, where it produced empty charts.
[18717] Fixed a crash after editing geometry by dragging, which could also lose the drag.
[18856] Fixed element-wise operations returning one value per row when the first input is a scalar column and the second an array column.
2.8.7
Features
[18502] Painting on a read-only semantic segmentation, such as a prediction, now copies the painted pixels into the editable semantic segmentation of the same row. Shift+click in Pan mode copies the shape under the pointer. A flood-fill toggle in the chart toolbar, on by default, grows the painted pixels to the whole shapes they touch.
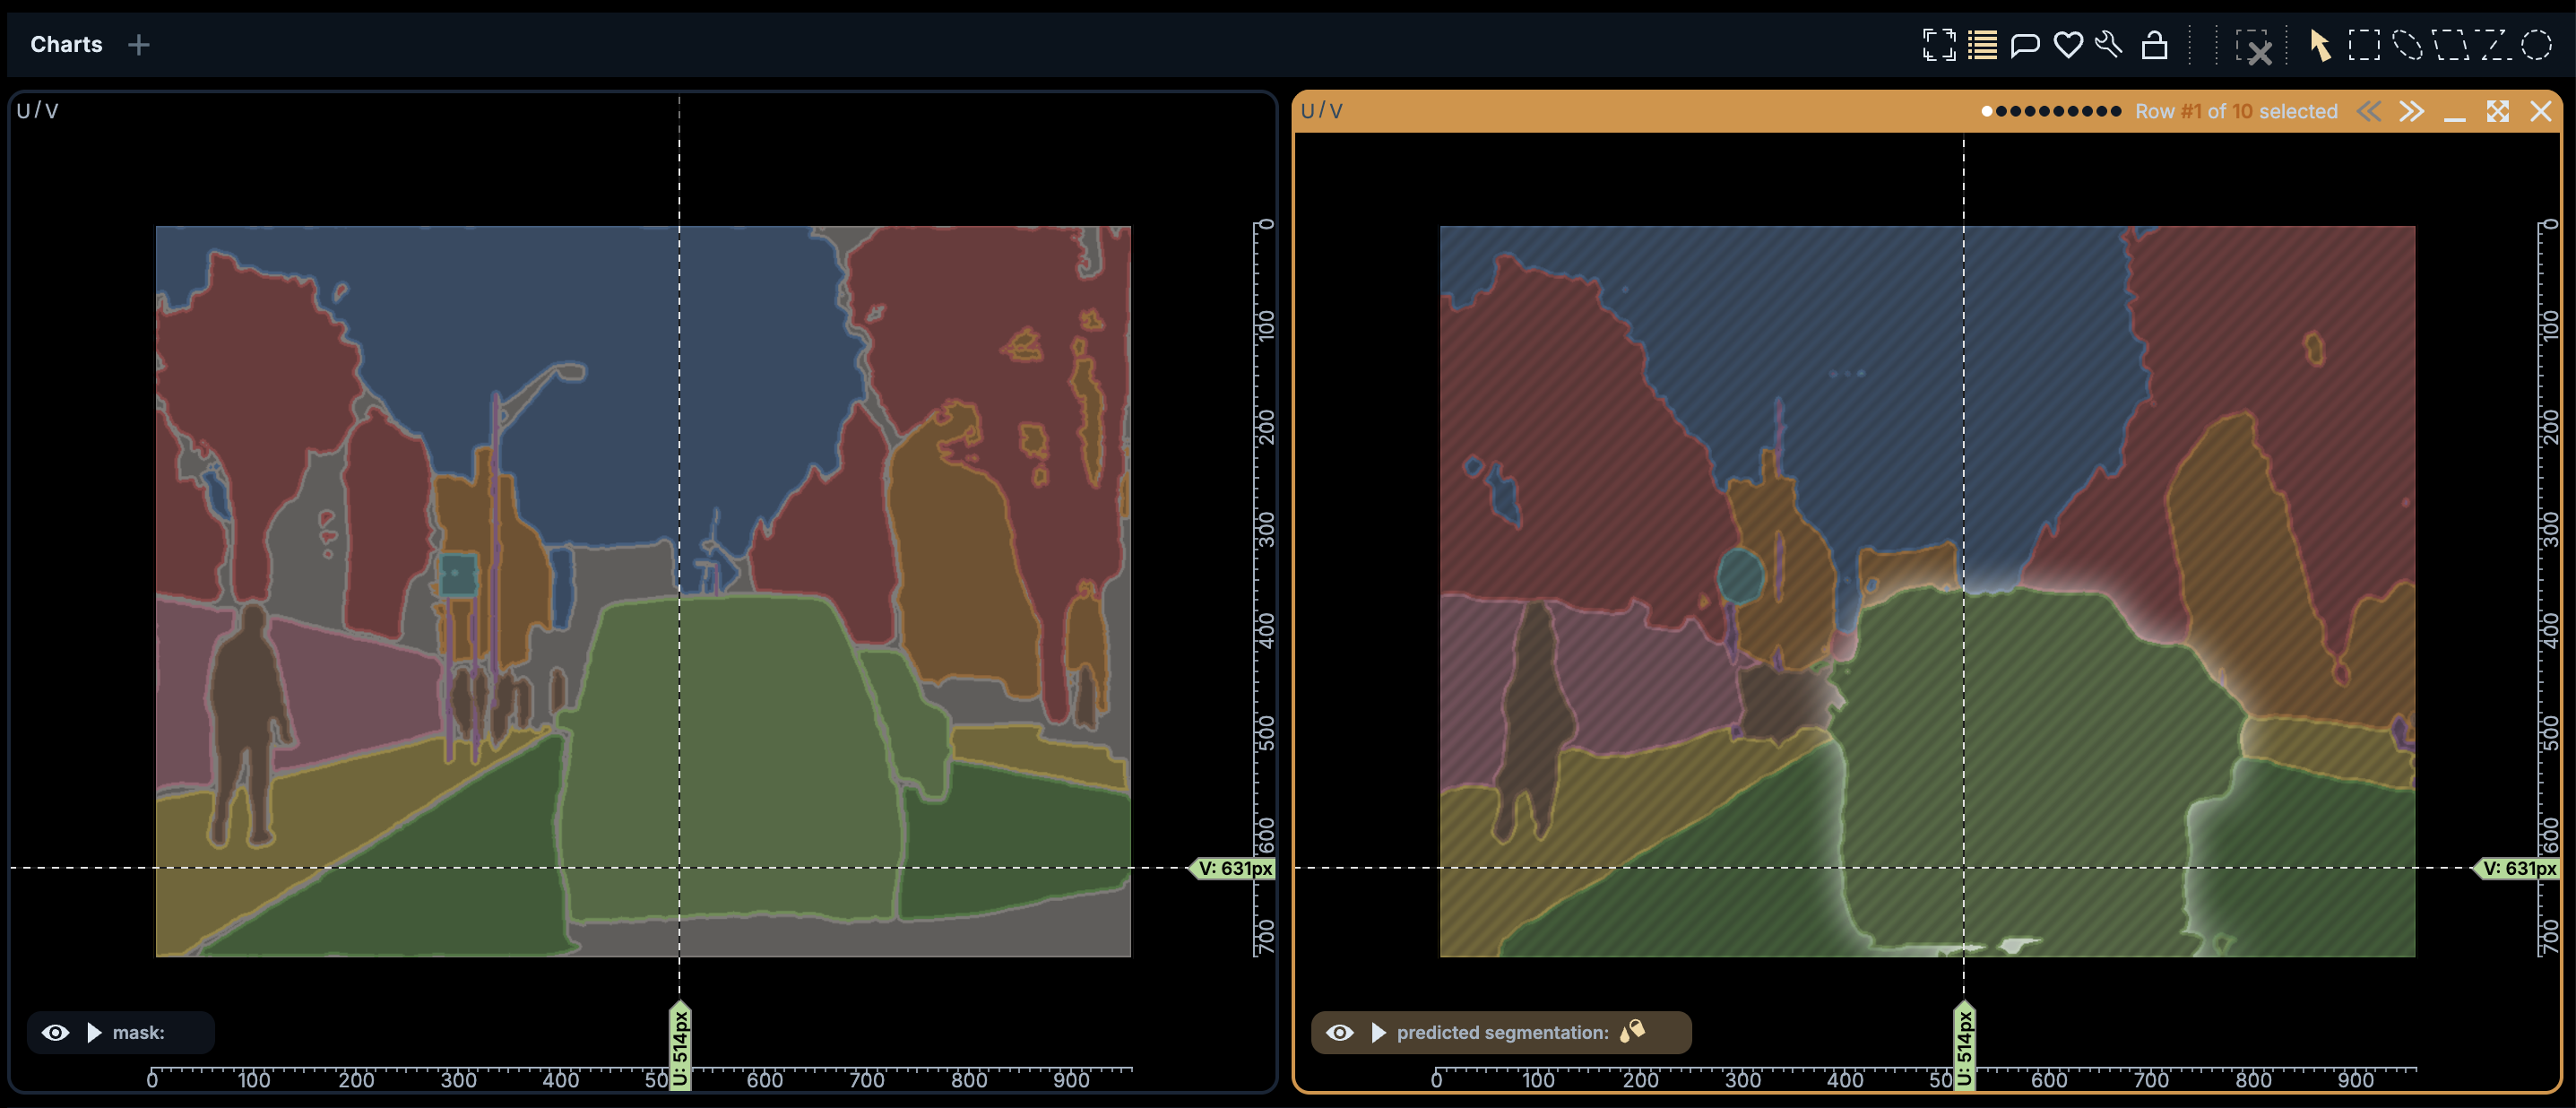
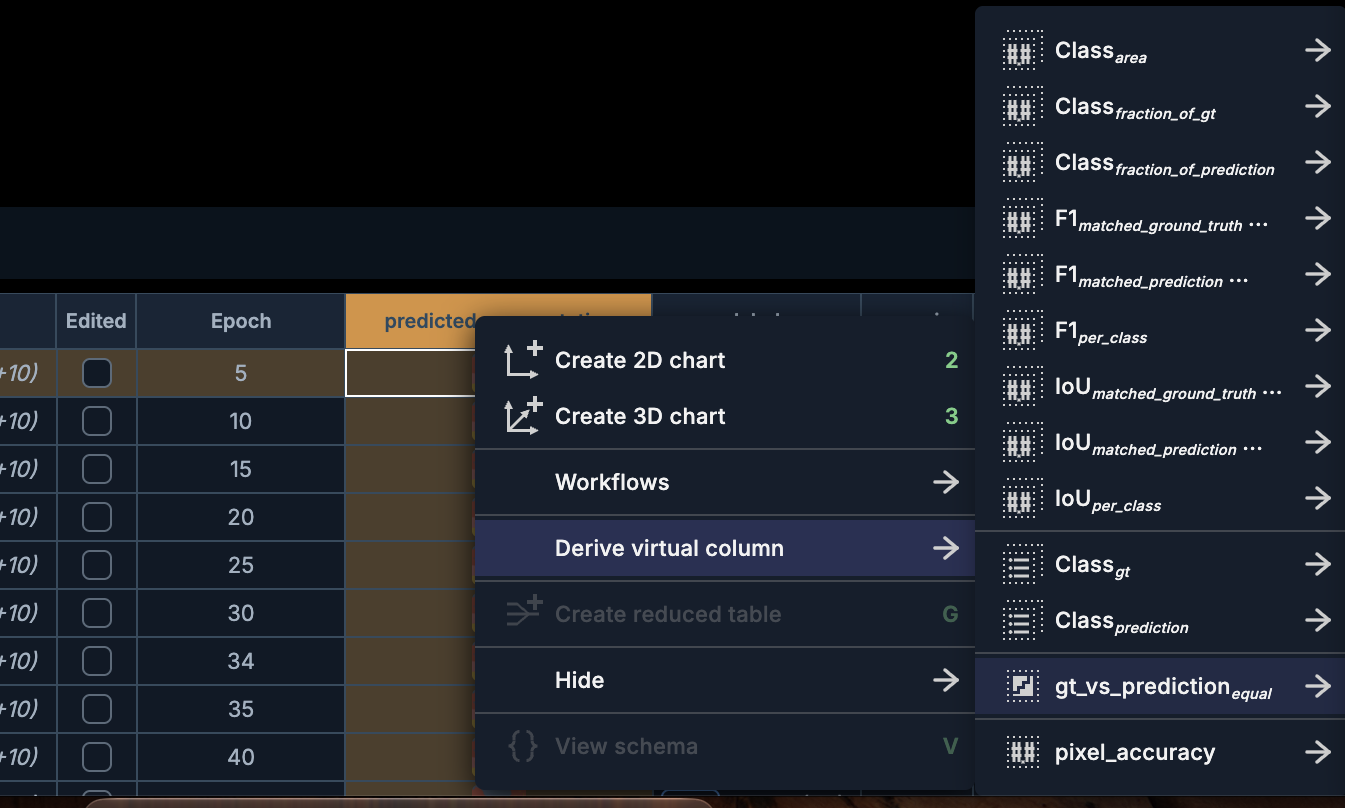
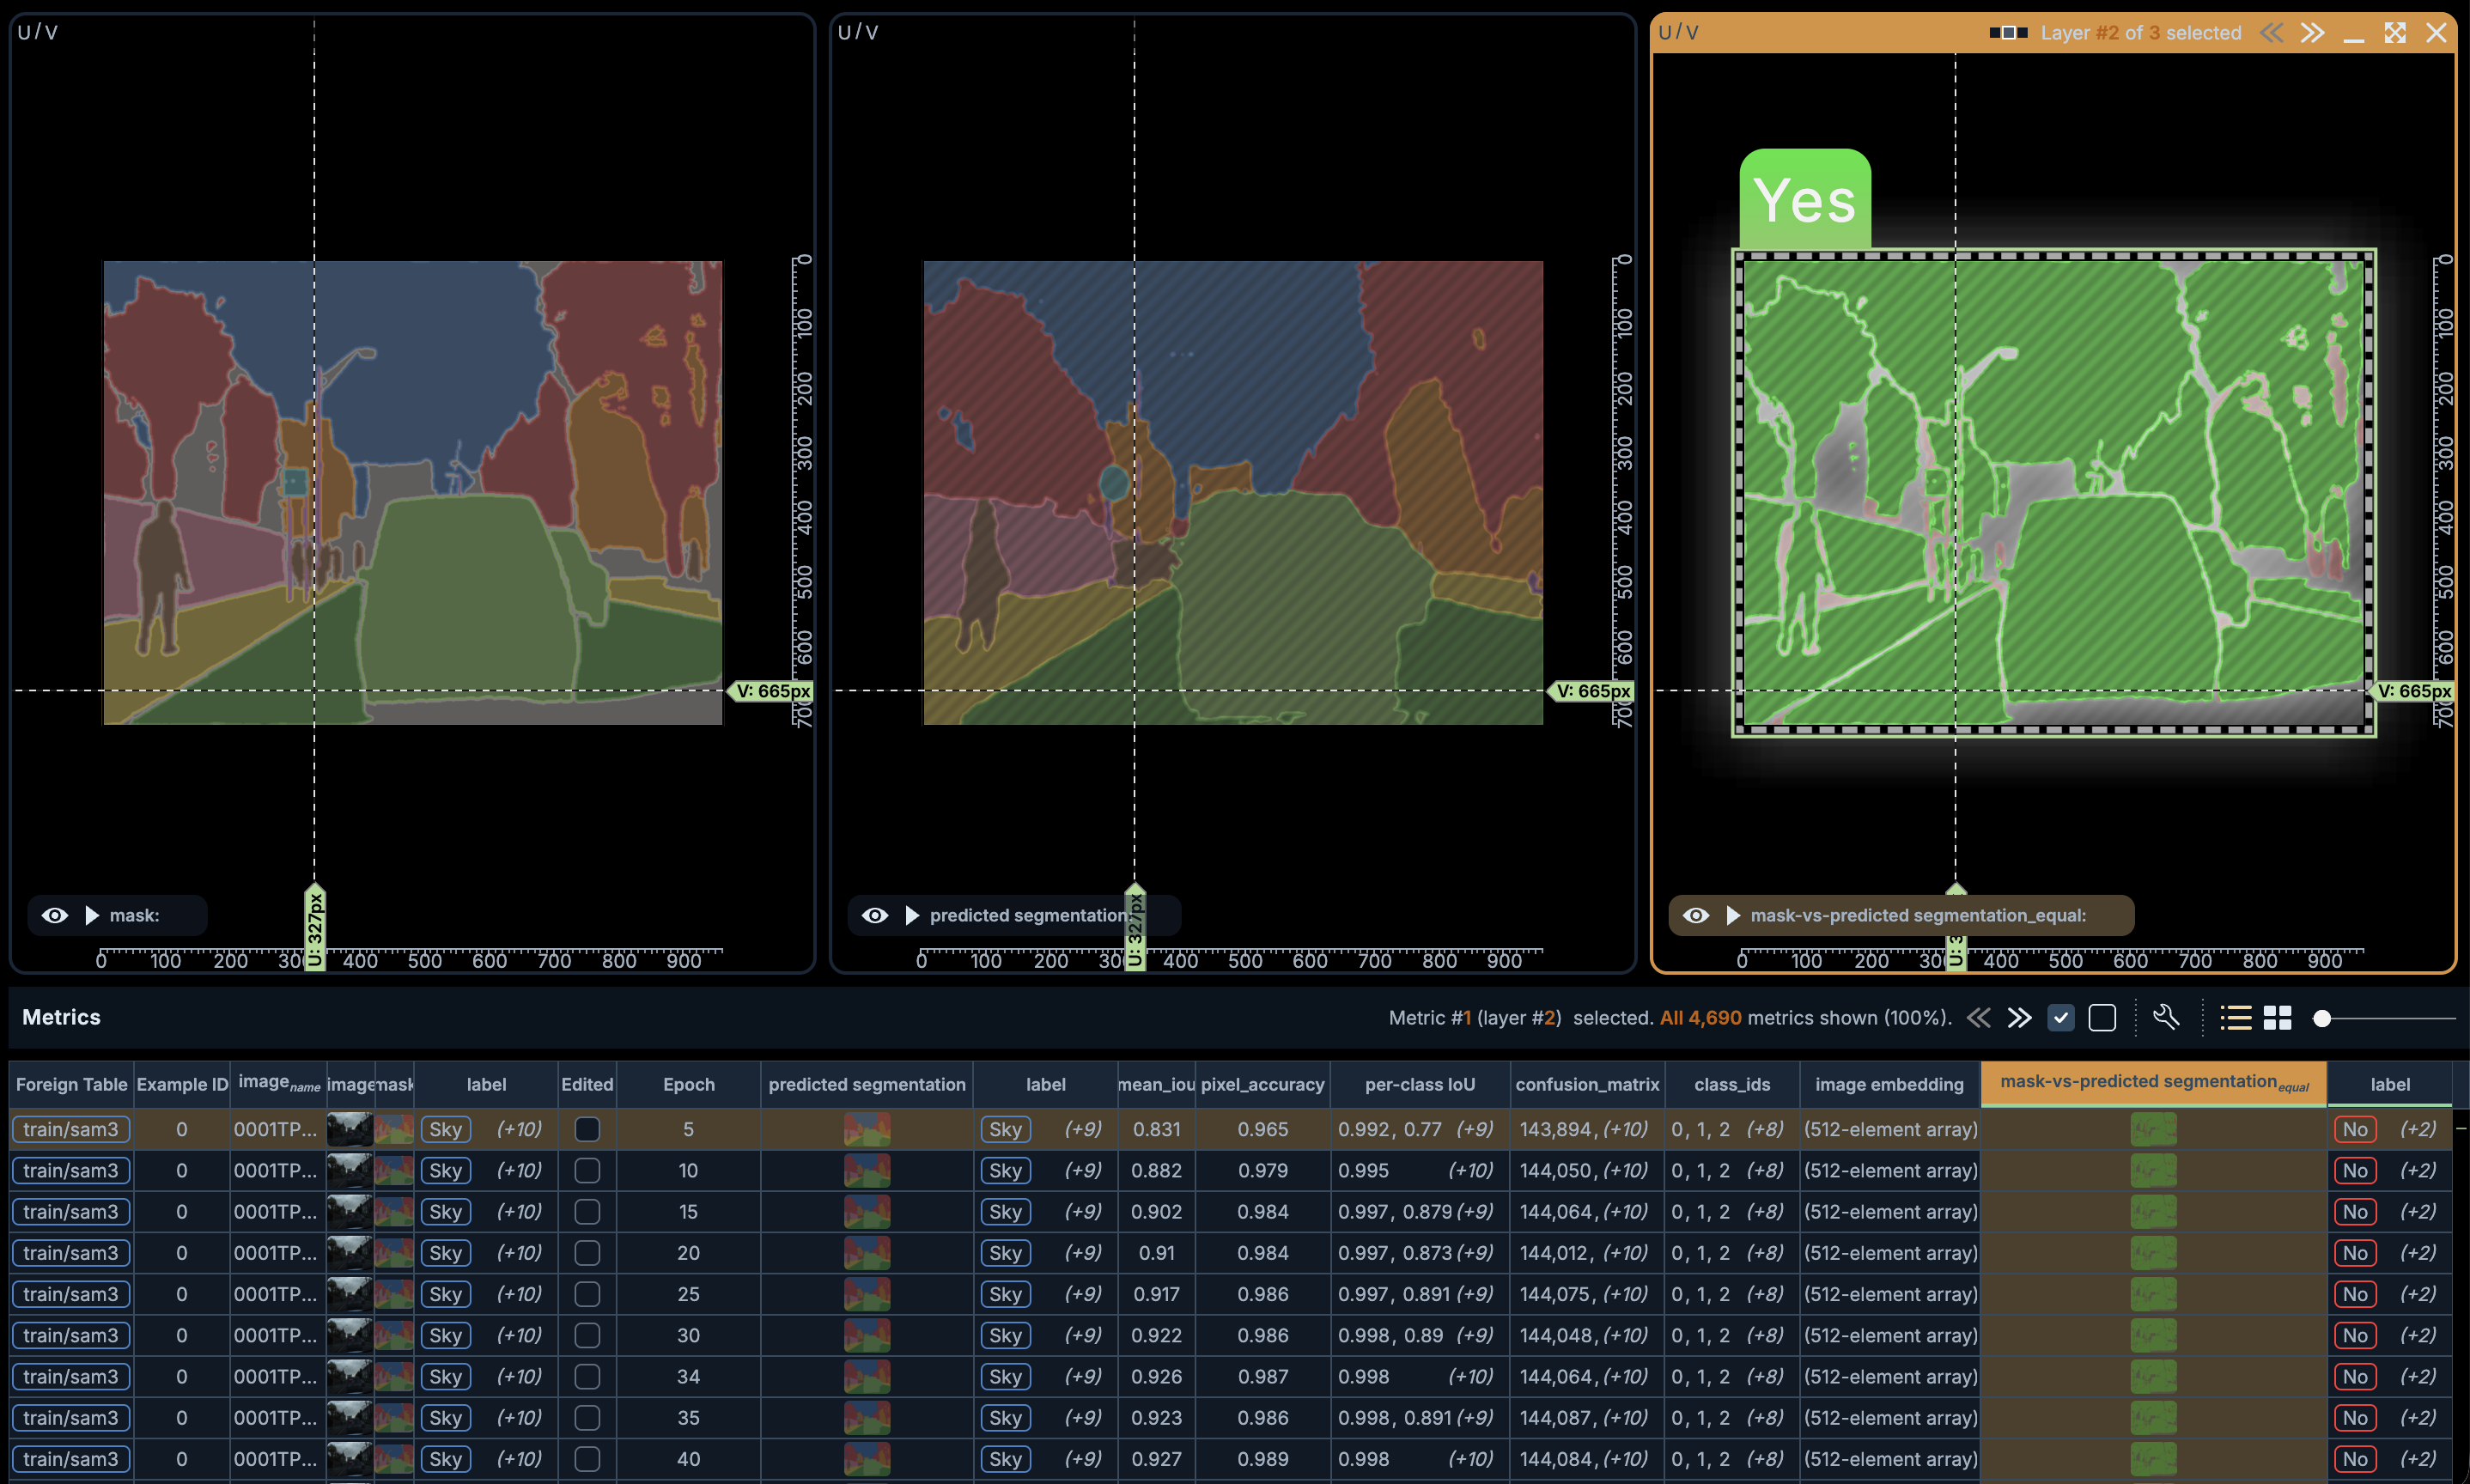
[18498] Added an operation for deriving a per-pixel agreement segmentation from a ground-truth and prediction semantic-segmentation column pair, marking each pixel as matching, not matching, or void. Both ground-truth-versus-prediction operations are also noticeably faster, especially on large images.
[18367] [18486] Added three Semantic segmentation confusion matrix workflows, normalized by ground truth, by prediction, or by pixel area. Each builds a 3D pillar chart of ground-truth versus predicted class that shows only the confusions. Clicking a pillar narrows the view to that cell and selects its most important row. Use the arrow keys to browse the remaining rows.
[18520] [18524] Hold Alt (Option on macOS) while using the Brush on a chart to filter continuously as the mouse moves. The table and other charts follow the brush, so you can sweep across a chart to find an interesting cluster without releasing and undoing.
[18501] [18500] Hovering a box or pillar in a 2D or 3D histogram now shows the binned axis values, the value its height encodes, and how many entries it holds. Hovering a segmentation layer shows the columns the Table panel shows for that layer.
[18389] [18523] Hovering a column header in the Table panel highlights that column’s axis names in the charts, and vice versa. 3D chart axis names can be clicked to select the column, used as drop targets for columns, and dragged onto anything that accepts a column. Hovering a 3D tickmark or its number shows the exact value it marks.
Connection problems are now shown by the service status button in place of a banner across the Dashboard. Clicking it shows the connection state, what to do next, and an editable service URL. When connected, the menu shows how long the connection has been up.
[18588] The line opacity slider is now called Line strength. On 2D charts, values from 1 to 2 make lines thicker.
[18640] 2D charts with a value map on both axes, such as label versus predicted label, now draw square cells regardless of window shape, so they read as a proper confusion matrix.
[18505] Live tooltip thumbnails now cover the same area regardless of the image’s aspect ratio or resolution. Added a Medium tooltip size, which is the new default for chart points and table rows. A tooltip size previously saved as Large now reads as Medium.
Enhancements and Fixes
[18641] Fixed the Dashboard loading more slowly the longer a browser profile has been in use.
[18596] Box and histogram heights and tooltip values are now the exact average of their entries. Previously, the values could be imprecise on axes with a wide range.
[18485] Numbers and axis names on 3D chart rulers now read right-side-up from any camera angle.
[18602] Chart ruler numbers now use thousands separators.
[18603] Histogram bars no longer show count labels. Hover a bar to see its count in the tooltip.
[18521] 2D histogram bars are now banded along their height, like 3D pillars, making bar heights easier to compare.
[18597] Points and surfaces in 3D charts are now lit from the same direction.
[18590] 2D plot-area shading is now drawn under the data, so chart colors match the legend and tooltips.
[18589] The grey unfiltered elements in reduced charts now use the same grey as filtered-out elements.
[18601] Reduced the drop shadow and glow on large selected or hovered bounding boxes and segmentation instances.
[18582] Clicking a box chart pillar now fades the other pillars, and clearing the filter restores all pillar colors. Hovering the grey unfiltered curve of a reduced line chart shows that curve’s own value.
[18491] Live tooltips showing an image now wait until the image has loaded and use its aspect ratio.
[18484] [18466] Column names in workflow step annotations are now drawn as column headers and can be clicked to select the column. Chart annotation text is smaller than the chart title.
[18487] The column schema dialog now supports horizontal scrolling.
[18616] The About window now shows the 3LC logo and is sized to its content.
[18497] Restored class counts in the Edit value map dialog for bounding-box tables. Classes with no uses can be deleted again.
[18599] Improved the names of ground-truth-versus-prediction operations and the class columns derived from them.
[18522] Bounding boxes no longer show arrows for attributes that happen to hold two numbers.
[18459] Opening a Run now consistently selects its first data tab.
[18503] Improved performance when computing segmentation layer statistics.
[18598] The segmentation layer tooltip now disappears when the cursor moves off the image.
[18606] Workflow menu entries are re-enabled as soon as a running workflow finishes.
[18506] Fixed tables getting stuck in “Unpacking…” when a Dashboard tab was left open across a Dashboard update.
[18509] Fixed a crash when building filters for list columns that contain some non-list values.
[18595] Fixed a crash when displaying reduced charts without a color property.
[18507] Fixed 3D rulers stopping partway through drawing when the browser reclaimed the WebGL context.
[18492] Fixed errors in Runs charts when runs log metrics with similar names, such as
train/lossandtrain_loss.
2.8.6
Features
[18414] Added a Polyline paint tool for instance-segmentation layers. Click points and double-click to finish, or press, drag, and release to paint a straight line. The tool uses the current brush size and can be enabled or disabled in Settings. Painting can also create a new instance layer automatically when no layer is selected.

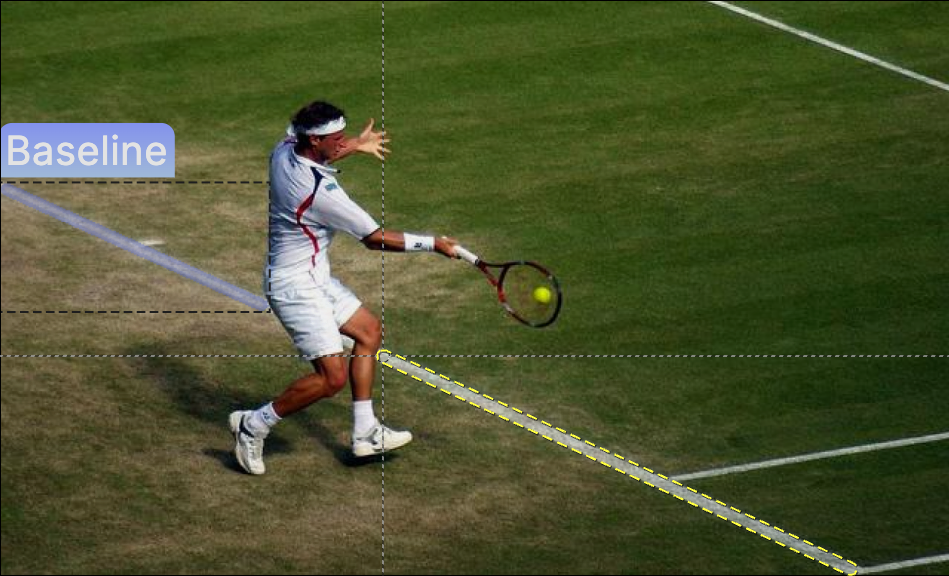
[18404] Added a new tool for creating oriented bounding boxes. Place the three defining corners with click-click-click, click-drag-click, or click-click-drag. The pending edges are shown while the box is being created.
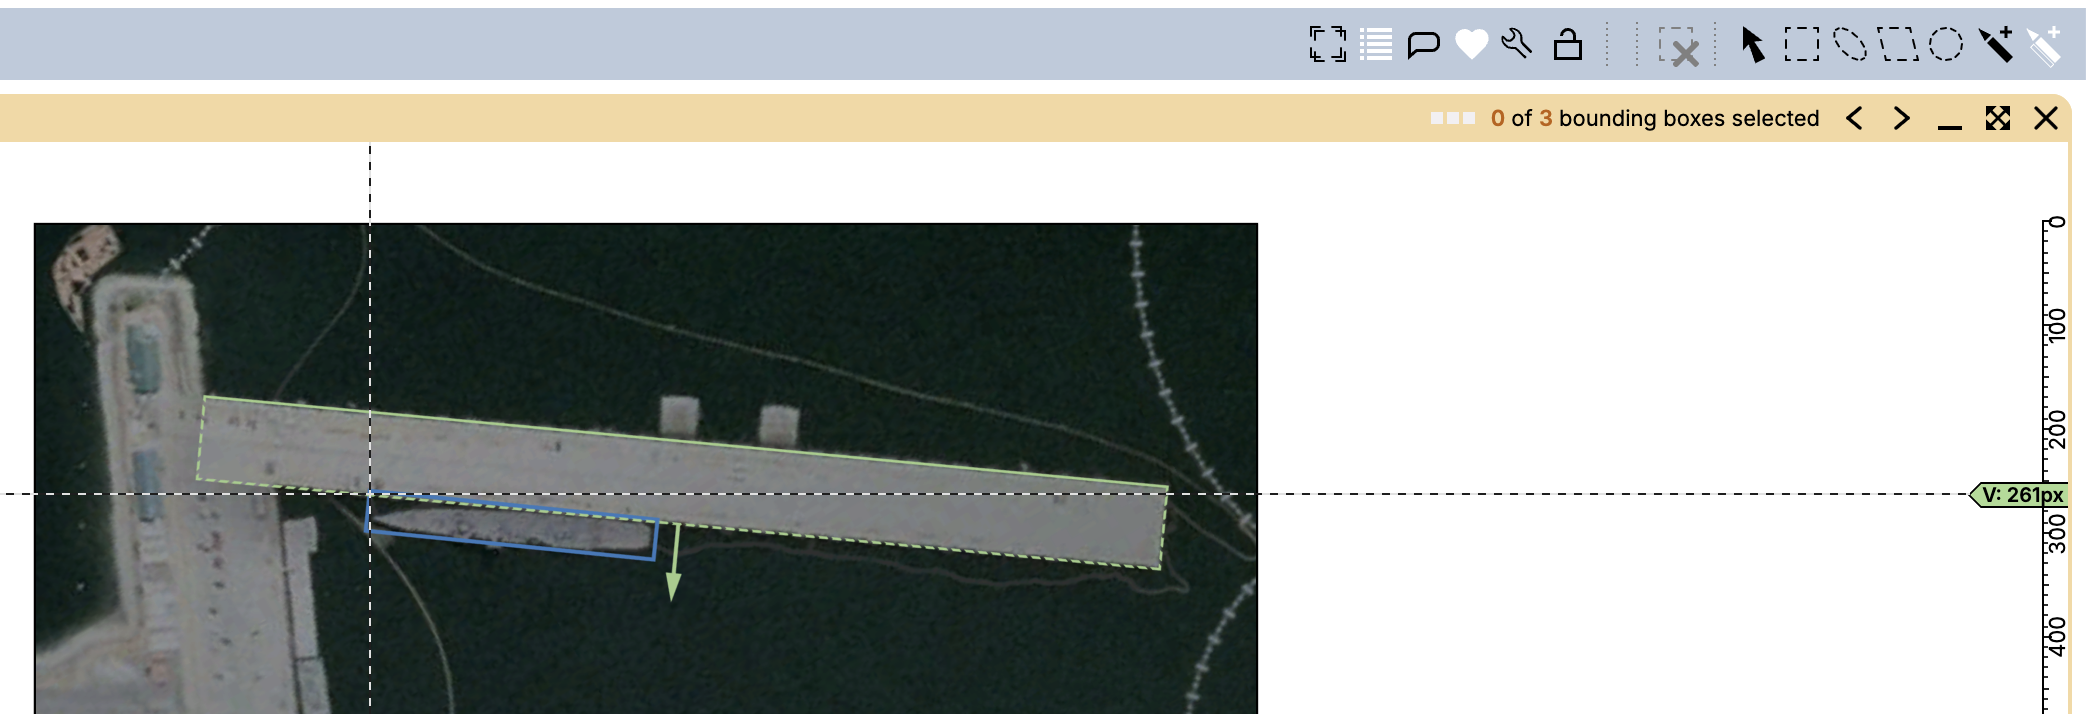
[18415] Added an adjustable brush size for painting. The brush footprint is shown at the cursor and can be adjusted in Settings, with Shift+mouse wheel, or by scrolling horizontally over the canvas.
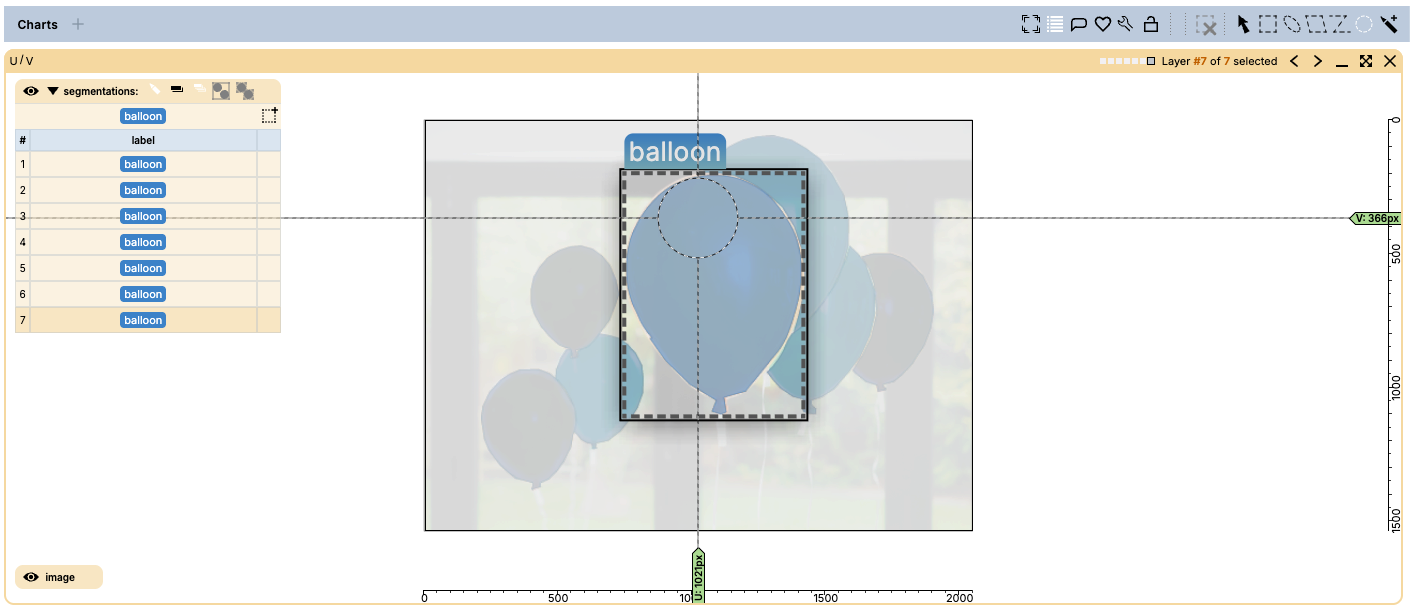
[18403] Added keyboard shortcuts for setting the active categorical value directly. Hold Alt (Option on macOS) and press the key shown for a value in the label selector or keyboard cheat sheet.
[18319] Added configurable live row previews to chart points, table array-element chips, instance-list rows, and partial-selection indicators. Hovering a chart point can show the corresponding table row. Points representing an array element show that element alone, zoomed to its bounding box. Set each preview surface to Off, Small, or Large in the new Tooltips section in Settings. Chart previews are off by default.
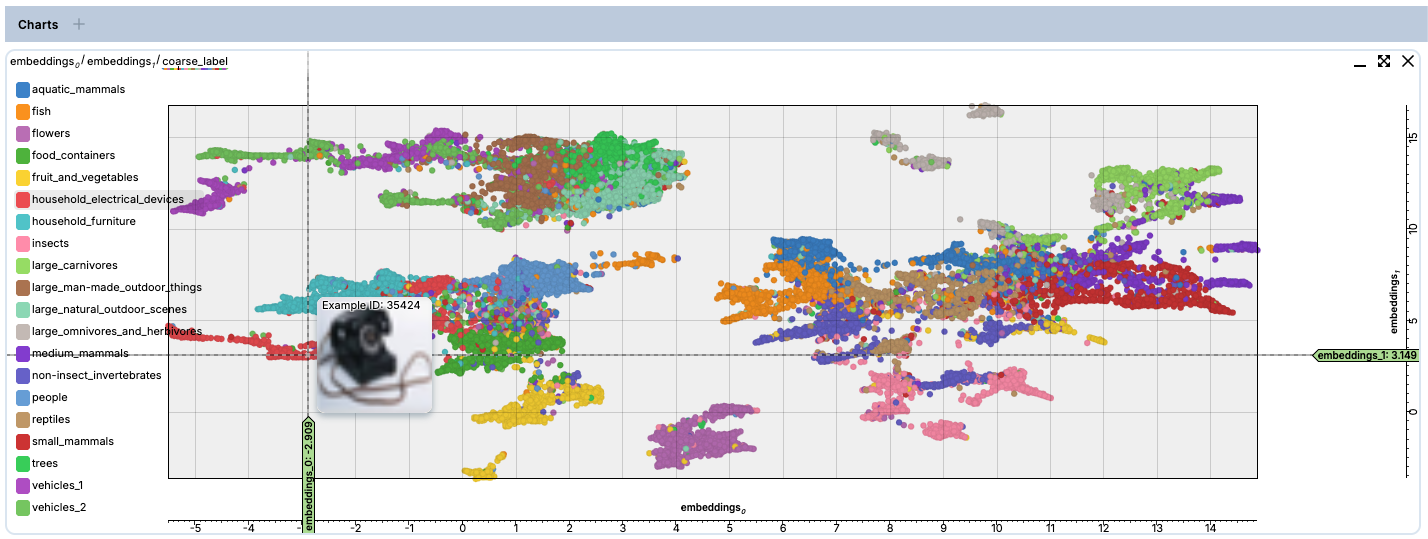
[13335] Hold Shift while dragging an instance to leave a copy at its original location and move the selected instance.
[18331] Added an operation for deriving a ground-truth-versus-prediction semantic-segmentation column.
[18211] Double-clicking a chartable table-column header now creates a 2D or 3D chart for that column. This can be turned off in Chart Settings.
[18267] Added a context menu for chart points, providing the relevant actions for the selected point. Open the menu by right-clicking a point.
[18354] Added a random-index column for sampling and renamed the existing index column to make its fractional value clear.
[18398] Added Settings actions for clearing all saved favorite charts or favorite virtual columns.
[18263] Added an option to show informational, warning, and error messages from operations as snackbar notifications.
[17017] Accepting predictions can now remove overlapping, unmatched ground-truth instances. The accept dialog provides an enable switch, an IoU threshold, and a preview of the instances that will be removed.
Enhancements and Fixes
[18408] The label selector now shows each value’s filtered-in and total count, a distribution bar, and sorts unsorted values by frequency.
[18409] Improved picking of bounding boxes and instances by allowing their edges and corner handles to be selected from slightly outside the shape.
[18410] Pressing Esc to clear selected array elements now keeps the active interaction mode.
[18405] Keyboard shortcuts are now displayed using the familiar platform-specific key symbols and are aligned in menus, selectors, and the keyboard cheat sheet.
[18390] Scrolling horizontally over a chart now adjusts point size. The same gesture adjusts brush size while a paint tool is active.
[18387] Improved the display of selected axes in 3D charts.
[18337] After deleting table rows, the next available row is selected automatically.
[18213] Chart values, hover tooltips, filter summaries, and slider values now use thousands separators where appropriate.
[18192] Tooltips for URL aliases and relative paths now show the resolved location, and long paths are no longer truncated unnecessarily.
[18196] Copying or cutting a pose now preserves its keypoints and associated geometry when pasted into a compatible column.
[18188] Added a setting to hide the hover and selection outlines around instance-segmentation layers.
[18197] Improved matching of accepted predictions and ground truth so the accept action agrees with the displayed IoU/OKS matches.
[18318] Fixed flickering of projected points inside bounding boxes while filtering.
[18316] Improved selection of nested read-only bounding boxes and made rank-box picks consistent across columns.
[18325] Restored the overall annotation-size setting.
[18332] Prevented empty favorite charts from being created automatically.
[18327] Hid table value-cycling controls when they do not apply to the selected object.
[18361] Fixed text-entry handling for Command key combinations on macOS.
[18364] Settings search is now cleared whenever the Settings dialog opens.
[18388] Improved resilience when editing shapes that contain a stale vertex index.
[18336] Fixed intermittent startup hover issues.
[16570] Messages shown while running an operation now state which operation they come from, making it easier to follow progress and troubleshoot when several operations run at once.
[18298] Improved 3D chart hover lines so they remain visible over projection shadows.
[18281] Hide the
Filter oncontext-menu item when it cannot be applied.[18258] Double-clicking a Run or Table now consistently opens its associated data tab.
[18232] Prevented failed media requests for reduced rows whose values contain multiple or no media items.
[18231] Improved chart reliability when many charts are open by sharing a WebGL context between charts.
2.8.5
Features
[18101] Table cells now load a downsampled preview instead of the full-resolution image, reducing memory and network use for tables with large images. Requires thumbnails to have been created for the dataset using the mechanism in the
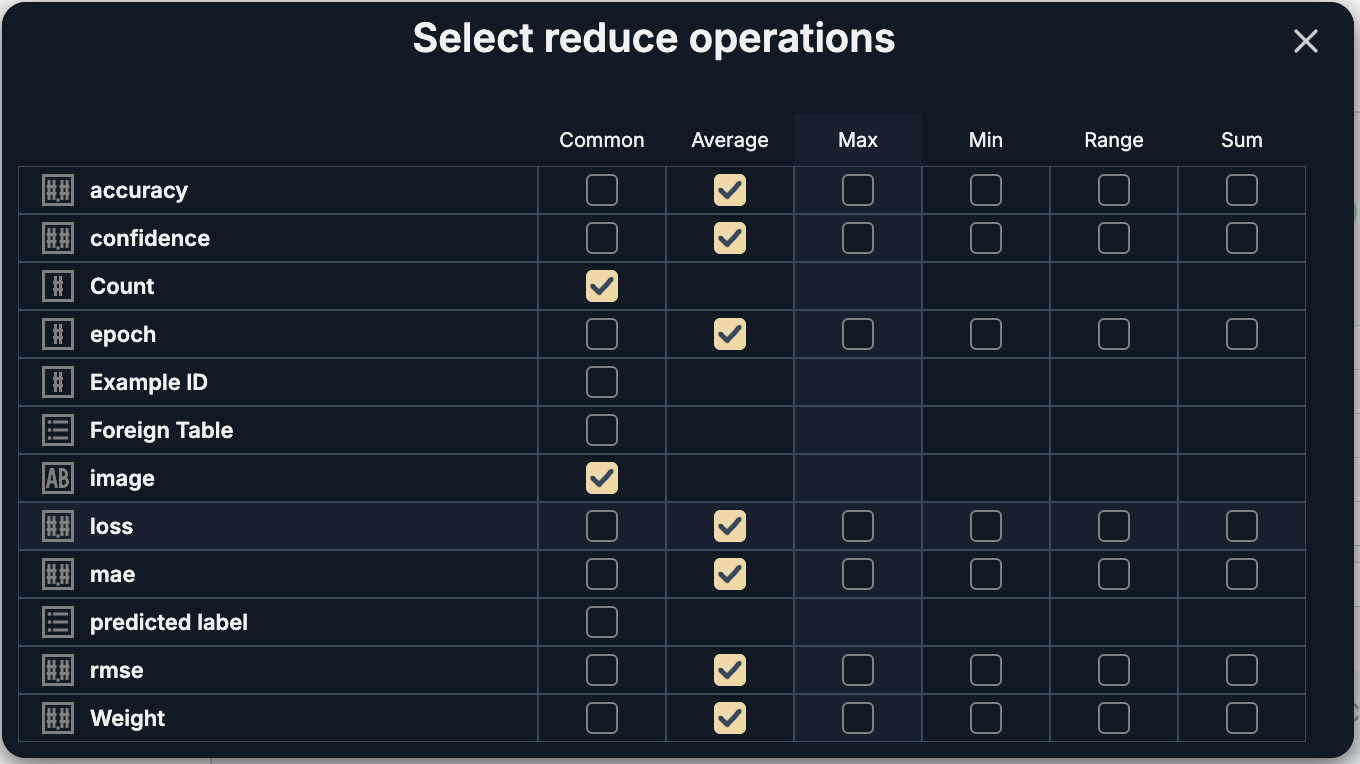
3lcPython package. Falls back to full images when thumbnails are not available.[18161] Added support for selecting which operations to apply when creating a reduced table
[18086] Improved tiling and scrolling for many charts. Chart rows are now tiled over their natural height, so charts overflow into a smooth vertical scroll instead of being squashed to fit. The new setting
Max charts side by sidecan be used to select how many charts to tile next to each other.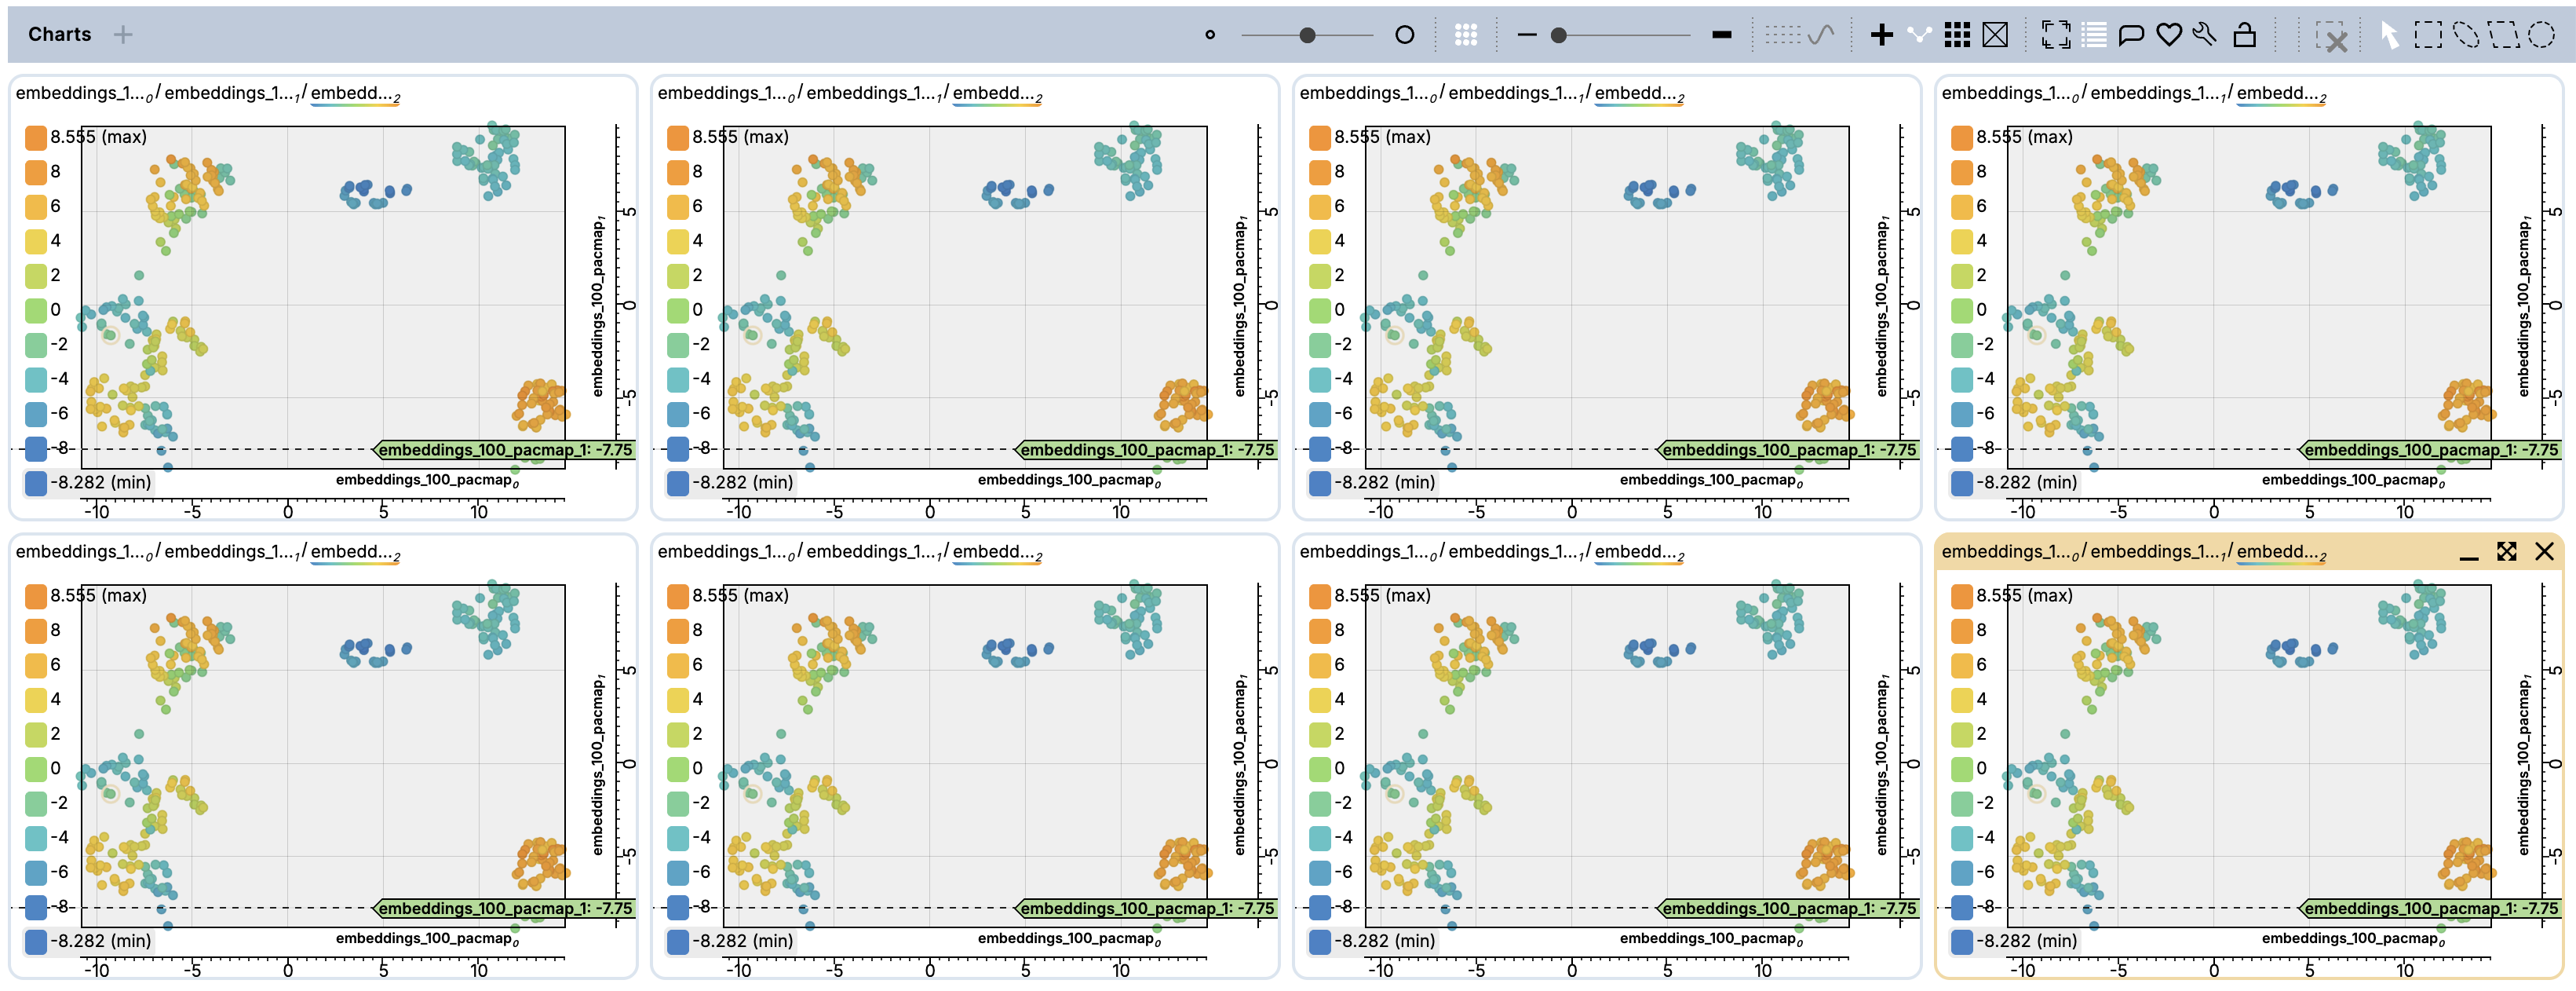
[18087] Added easier single-axis scaling using the mouse on 2D chart rulers. Hovering one shows a resize cursor:
Mouse wheel over a ruler zooms that axis only.
Dragging along a ruler pans that axis only.
Double-clicking a ruler snaps to contents on that axis only, mirroring the background double-click.
[16376] Added support for setting a paint-bar property (e.g. visibility) on all filtered-in points, lines, or triangles at once, from the context menu.
Enhancements and Fixes
[18089] [18109] [18110] [18104] Made various optimizations to improve performance when handling large images and segmentations.
[18141] Show stream name when a metrics table group contains one metrics table.
[18008] [18009] Made improvements to startup performance.
[18094] Hide filtered-out points/lines in embedding travel chart.
[18096] Always respect schema property
default_visibledirectly and in derived columns to determine which columns to show.[18128] Handle the void class in pairwise IoU calculations for semantic segmentation.
[17955] [18105] [18095] Fixed several minor chart display issues.
[17956] Fixed a regression where favorited charts on virtual-column axes (e.g. an embedding pick) would not automatically reappear.
[18042] [18014] [17934] Fixed several issues with Workflows:
Missing sort arrows after a Workflow sort
Workflows silently doing nothing when the wrong join group was selected
Hidden panels appearing after running a user defined workflow.
[18007] Use loaded image size when committing paint edits.
[18129] Leave the camera alone when a picked instance has no pixels.
2.8.4
Features
[15202] Added support to Group & Ungroup instance segmentation layers


Enhancements and Fixes
[17906] Made optimizations and fixes across app improve to performance and overall user experience, particularly with table rendering and charts.
[17900] Cycle through overlapping instances on repeated clicks.
[17909] Made it possible to drag Settings, Cheat sheet, and Workflows windows by their title bars.
[17017] Accept dialog glow-up.
Made it possible to drag using the title bar.
Gave it a consistent dark look.
Improved flowchart and standardized details so it can more easily be read at a glance.
Active boxes are filled and carry the pseudo-3D “element count” stack (now also red when the box warns).
Empty or disabled boxes become quiet dashed outlines with dimmed text.
Dashed = inactive, everywhere - including the arrows, whose dashes match the box outlines exactly.

[17918] Fixed remaining per-sample-lineage bugs.
Read-only columns no longer offer lineage ops.
Avoid showing samples as revised in the current revision when they are not.
Fixed issue showing inaccurate revision count in some cases.
[17537] Fixed an issue that resulted in buggy virtual property values after NMS segmentation.
[17743] Fixed issues with smooth lines toggle so it always applies with enabled and provides a tooltip on explaining why (e.g. “too many lines to smooth”) when disabled.
[16604] Fixed problems with label policy for pose/keypoints.
[17938] Restored intended behavior to open Tables panel on double-click when Project has no Runs
2.8.3
Features
[17506] Made it possible to keep read-only columns in sync with a baseline editable column so that they stay compatible as edits are made. For example, 2D/3D embeddings associated with predicted bounding boxes may be synced as edits are made to ground truth bounding boxes. Synced columns are automatically created when baseline schema attributes are provided.
[17808] The 2D/3D property GUIs (Geo and Image) now show an expandable list of the filtered-in instances and bounding boxes right where you’re working.

[17768] Expanded support for semantic segmentation, with per-class IoU and pixel-accuracy operations (void pixels ignored), class-confusion histograms, and two new workflows: per-pixel confusion matrix and class IoUs vs accuracy. See the updated semantic segmentation page for details.


[17783] Added F1 overlap metric alongside IoU virtual columns.
Enhancements and Fixes
[17805] Hide label-list search box when all entries already fit.
[17820] Make troika 3D text offline; drop jsdelivr CDN dependency.
[17813] Fix OperationBin crash when array column row is scalar/absent.
[17845] Made it so element-wise-equal/not_equal use value map of input column.
[17847] Sort on arrays only uses filtered-in elements.
[17870] Alias
3lc-dashboard--object-service-auth-secretto--auth-secret.[17874] Made several updates to be consistent with font size and alignment in the table panel.
2.8.2
Features
[13285] Added support for per-sample lineage operations that can be used to trace revision history on a per-sample basis, comparing current values to the root revision, another specified revision, or the state of samples before any current uncommitted edits.
[17518] Enabled NMS on instance-segmentation columns.
[5602] Added Workflow for creating N-component plots to compare several metrics side by side on a single chart.
[16250] Added support to copy/paste BBs from one sample/image to another.
[8761] Added reduce operations to Create-column menu on ReducedTable. Also tweaked names of Reduced tables, and show name in Tables panel.
[12887] Added UnrolledTable type and create-from-columns action. This can be used to get a patch view of your detections.
[12591] Added Lock chart contents button to Selected charts toolbar. This allows for freezing chart contents even when filters or operations change.
[12736] Replaced the “Select one or more columns to visualize…” placeholder in empty Charts panel with an interactive chart-creation table whose details are filled in as columns are selected.


Enhancements and Fixes
[17477] Handle filename-safe ISO datetime strings (T HH-MM-SS).
[17466] Fixed issue causing sub-menus to overlap with their parent menu in some cases.
[17741] Added a semi-transparent background for overlay filters.
[17491] Extended OperationTraversalIndex to support jagged 1/2/3-component input.
[17492] Charts: respect per-element selection when drawing selection circles.
[17504] Restore behavior so that clicking on a point within a Run metrics chart on the Runs screen selects the Run.
[17513] Improve behavior of expanded histograms that show on hover, enforcing no more than one visible and limiting the height.
[16171] Harmonized the appearance of horizontal scrollbars in Workflows and Table panels.
[17127] Tweaked order of bounding-box annotations so they follow the unrolled column order of the corresponding Table window .

[17543] Fixed rendering of multiline chunks in Charts panel.
[13460] Tweaked Filter panel histogram display so they include a “middle layer” that shows the histogram with all other filter criteria applied (but not this one), and provide a similar view for enum filter displays.

[17533] Fixed issue where copying multiple rows would hang.
[16570] Aligned the appearance of the Tweak-selected-charts panel with the Table panel.
[17564] Fixed infinite retry loop on unresolvable media URLs.
[17578] Made it so checkboxes in context menus have same style as in the Table panel.
[17614] Made it so partial-selection-info component visually differentiates between table-row-selection and array-element-selection.


[17588] Make it so that frozen views are kept intact across BB delete, and across any subsequent edits, until the user explicitly toggles LiveFilters back on, instead of the old behavior where deleting a BB while LiveFilters was off used to reset the filter view to “everything visible.”
[17621] Restored green default BB outline, added High contrast option.
[17625] Fixed an issue where Down and Up did not work after deleting the last BB.
[17623] Do not show irrelevant attributes in settings window.
[14328] Exclude filtered-out array elements from filtered tables so subset tables respect filtering.
[17685] When determining the vertical scale in Filter panel histograms, ignore empty buckets to avoid tall spikes in sparse histograms.
[17697] Implemented several Chart optimizations.
[17698] Implemented several Filter optimizations.
[17699] Optimized table row rendering and live tooltips.
[16117] Show negative value map keys correctly in the filter panel.
[14345] Emit out-of-bounds sentinels in PickN operations.
[17712] Fixed filter lock vs clear/subset toolbar behavior.
[17736] Added search bar in settings dialog.
2.8.1
Features
[17378] Made it possible to create user-defined workflow from a pinned property widget

[17447] Added support for search in Workflows window

[16899] Made confusion matrix for BBs workflow create two tabs - one showing prediction-to-ground-truth and another showing ground-truth-to-prediction

Enhancements and Fixes
[17366] Allow more levels of PickProperty chaining (from max 2 to 5)
[17367] Fix NMS workflow not showing steps 3 and 4
[17376] Fixed regression to restore auto-scroll when arrow left/right navigates array elements
[17380] Fixed an issue where elements were not filtered properly in the table view when there are multiple runs in a session
[17381] Don’t filter embedding travel distance on selected
[17391] Show tooltips for truncated string property cells
[17393] Fixed regression to restore auto snap-to-contents on row change
[17407] Restrict Grid view to image/bbox columns when present, so that there is net excessive text covering images
[13460] Show full-height filter histogram on hover

[17418] Improved readability of selected filter and overlay column names
[16165] Fixed a bug where connecting lines in scatter plots were not properly shown
[17454] Use more saturated colors by default
[17493] Fixed an issue so that when navigating Left or Right to previous/next bounding box, snap-to-bb takes precedence over snap-to-image
[17424] For the hosted Dashboard, emit HTTP Strict Transport Security (HSTS) header on every response so browsers refuse cleartext requests after the first HTTPS visit.
2.8.0
Features
[17033] Implemented visual re-design
Calmer, more focused interface: Softer colors, subtler selections let users keep their attention on the data
Familiar, spreadsheet-style interactions: Tables, filters, and navigation follow conventions users already know, so common tasks feel more intuitive
One coherent visual language: Panels, toolbars, and controls share the same styling
Removed and reorganized many items, resulting in increased viewport real estate

Before

After
[16851] Made it possible to show and configure filters inside charts

[17056] Made it possible to resize columns in Rows panel
[17219] Added prediction status column for tracking whether each prediction has been accepted or rejected, along with a new setting for whether to automatically create it whenever a prediction is accepted or rejected (default false to preserve existing behavior)
Enhancements and Fixes
[16867] Fixed regression where the axis widgets in Chart toolbars weren’t consistently clickable or available drag targets (due to the partial selection info widget floating on top)
Added ‘x’ button to Layer components to allow for hiding overlay widgets in charts
[16883] Made improvements to element deselection behavior
When a text/number input field has input focus, Esc only blurs the widget, and does not deselect anything
When one or more array elements are selected (e.g. a bounding box), Esc only deselects these array elements, not the containing table row(s) themselves
When one or more table rows are selected, Esc only deselects the table rows, not the selected windows/columns
Only when none of the above applies will Esc cause windows/columns to be deselected
Updated array element keyboard navigation so that Left/Right no longer navigates to previous/next array element (that functionality is already covered by the Up/Down keys). Instead, they always navigate previous/next column (as they already do when no array elements are selected).
[16886] Handle the case when the dashboard encounters settings from a newer version than the one currently running (i.e. after downgrading to an older version)
[9385] Added URL detection and highlight in log message strings

[16876] Made Confidence configurable for TP/FP/FN
[15373] Support “Label policy” for IOU operation
Fixed a bug where it wasn’t possible to drag from the axis widgets within the chart
[16927] Fixed an issue where the editing label overlay layer was not responsive in some cases
[16937] Set the default confidence threshold to 0.25 instead of 0.5
[16963] Made it so Ctrl+LeftClick unselects a BB in a chart
[16974] Fixed a regression in F1/Precision/Recall per class workflows
[16970] Fixed a couple of checks to avoid null references and crashes
[16997] Fixed a bug where chart state was not cleared when navigating to a new table
[16994] Addressed a bug where new Runs were not loaded in some cases
[16991] Show number from color overlay on histograms in 2D charts

[15189] Modified keyboard shortcuts to work better with Mac (avoid those used by system, prefer Shift to Ctrl)
[17125] Fixed an issue where lasso select of ground truth bounding boxes did not behave like picking one by one
[17199] Auto-scroll columns into view when selected or referenced by workflow annotations
[17221] When changing labels for multiple BBs at once, do not also change other properties
[17323] Fixed array element (e.g. BB) title bar < > buttons to navigate BBs instead of samples, fall back to row navigation when no element selected
[17324] Fixed a bug where pose/keypoints did not display their label properly when there was a single enum value
[17072] Fixed a crash when loading tables whose struct/annotation columns contain int64 fields
[17016] Skip low-confidence predictions in Unmatched (FP) operation. Predictions below the effective confidence threshold are no longer flagged as False Positives.
[17214] Added tooltip and double-click clear to filter-status dot
