Data Types
Each column in a Table has a Schema that describes its data and tells the Dashboard how to display and interact with it. The built-in convenience schemas are the recommended way to define columns — each one configures the right data type, storage, and Dashboard features automatically.
The pages below document each data type in detail: what parameters are available, how to create tables from Python, how the data is visualized and edited in the Dashboard, and how to integrate with ML frameworks. For a one-glance list of every convenience schema, the Python type it produces, and how it is stored, see the Schema Reference.
Numeric, boolean, string, URL, and datetime columns, and fixed- or variable-shape arrays.
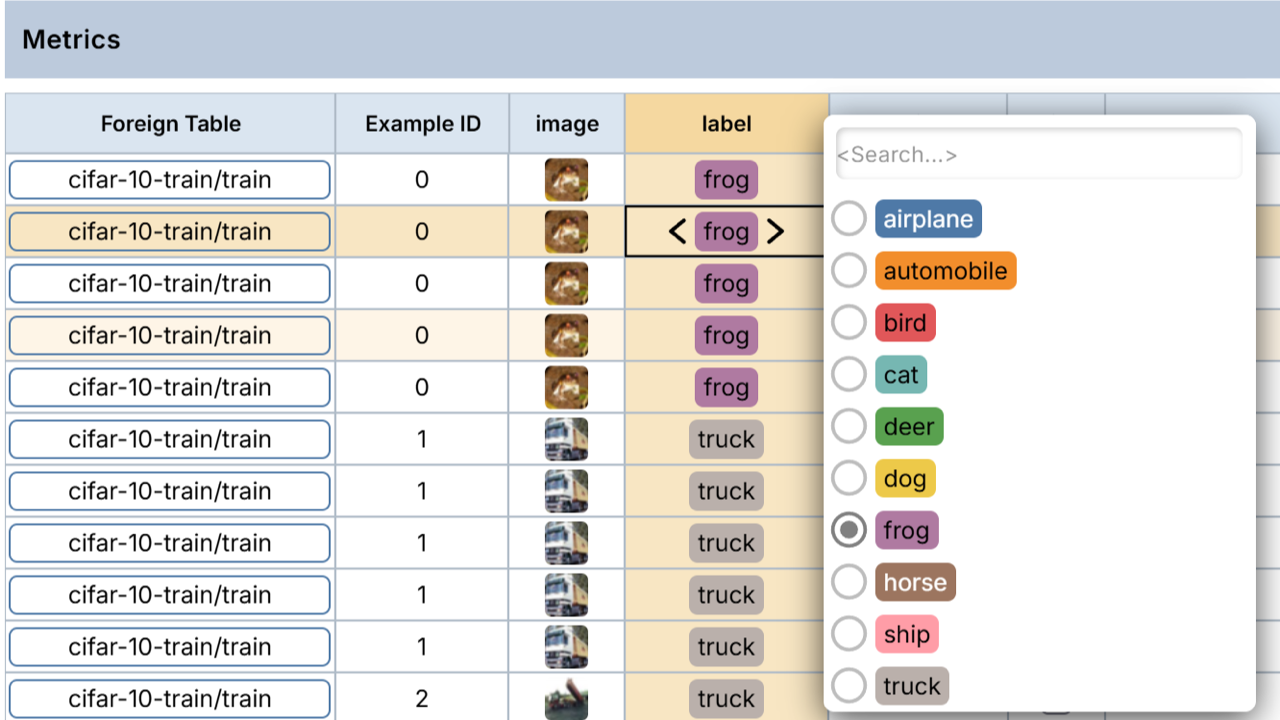
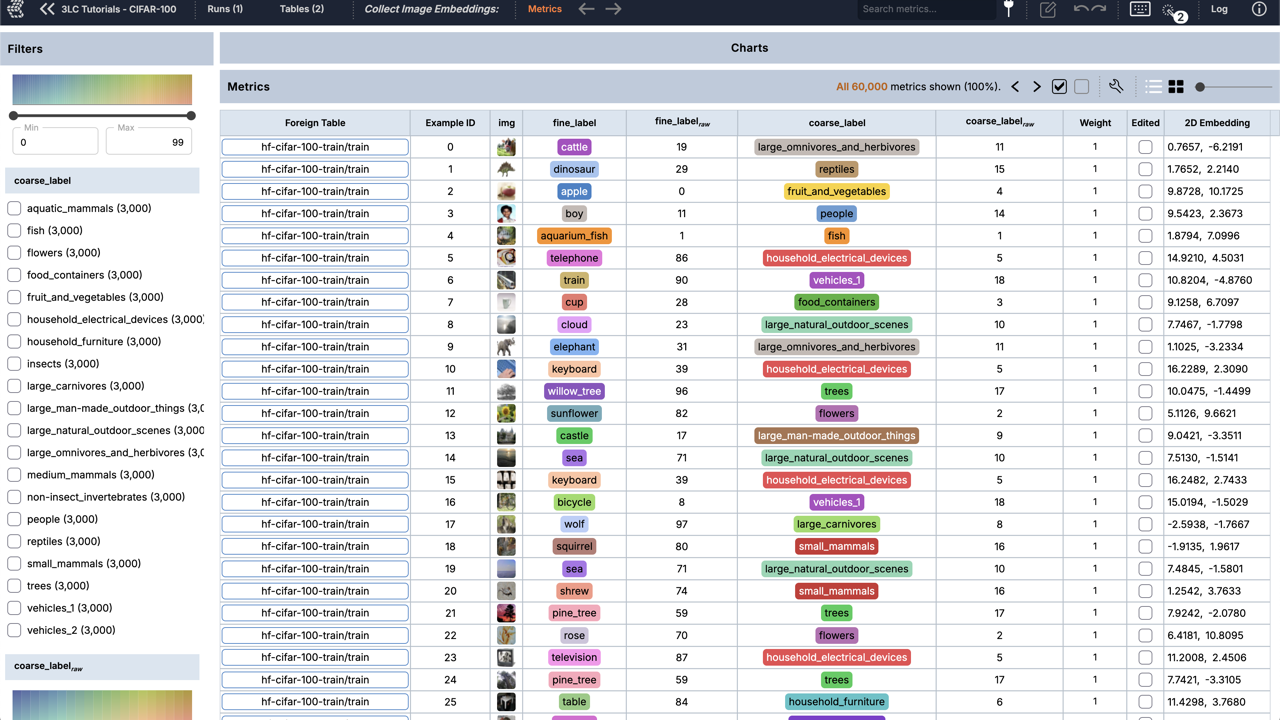
Integer values mapped to named classes — the most common label representation in ML.
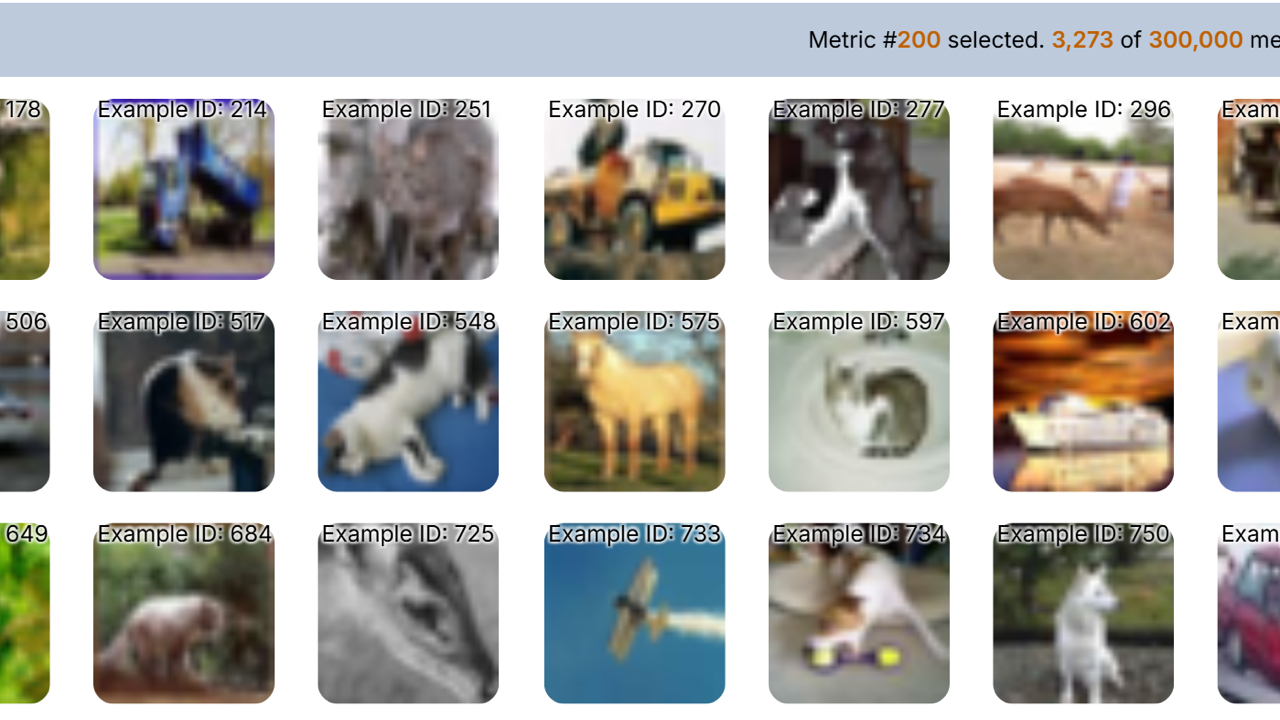
Store images as files or URLs and browse them in the Dashboard.
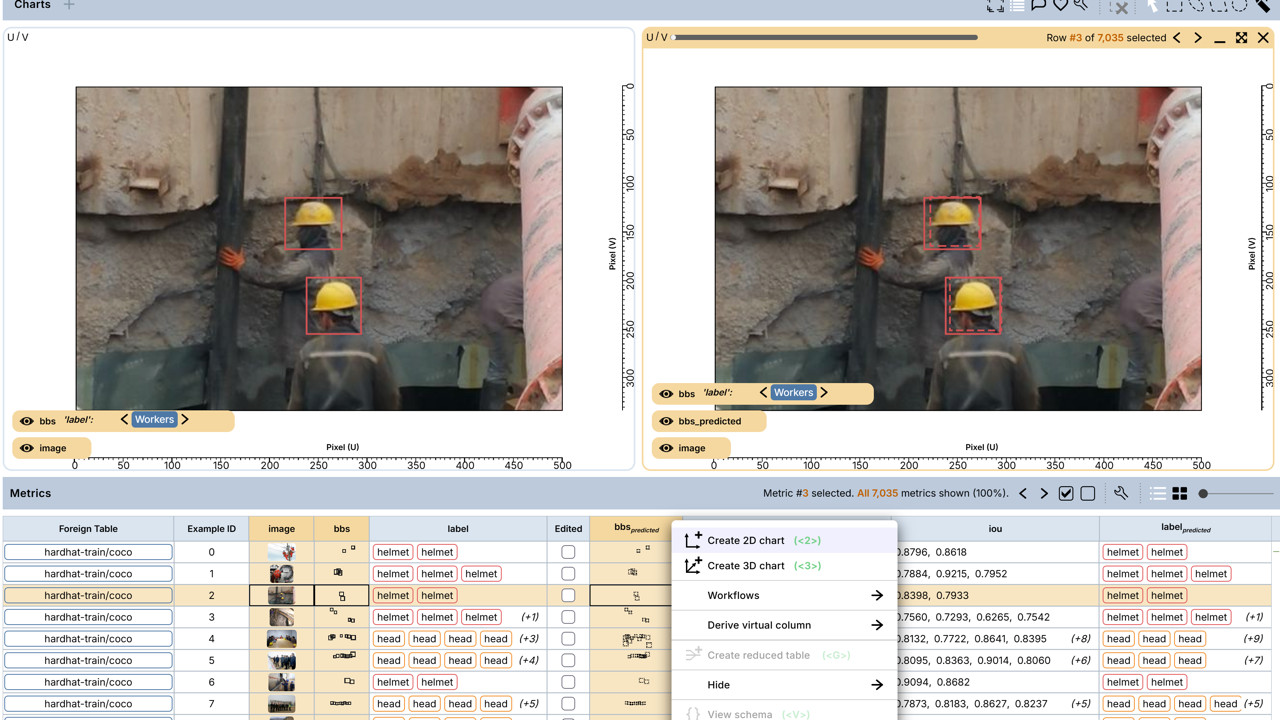
Axis-aligned 2D boxes with per-box labels and properties.
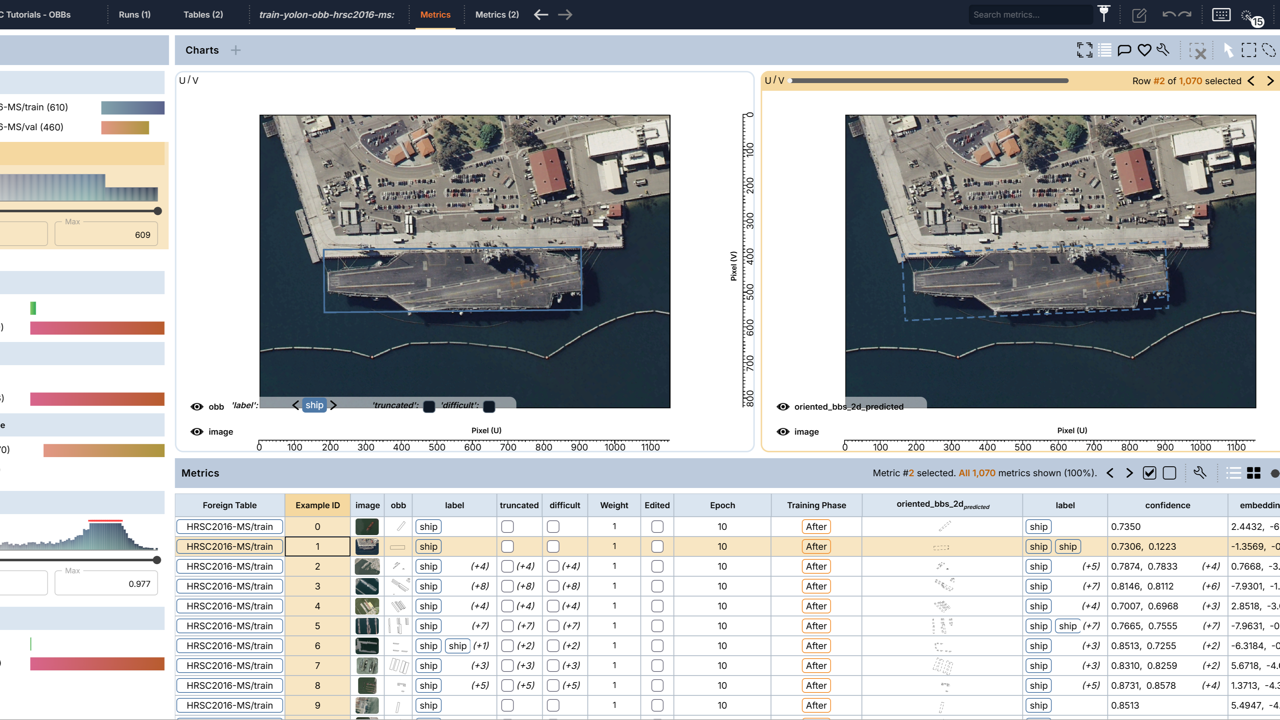
Rotated 2D boxes for objects that are not axis-aligned.
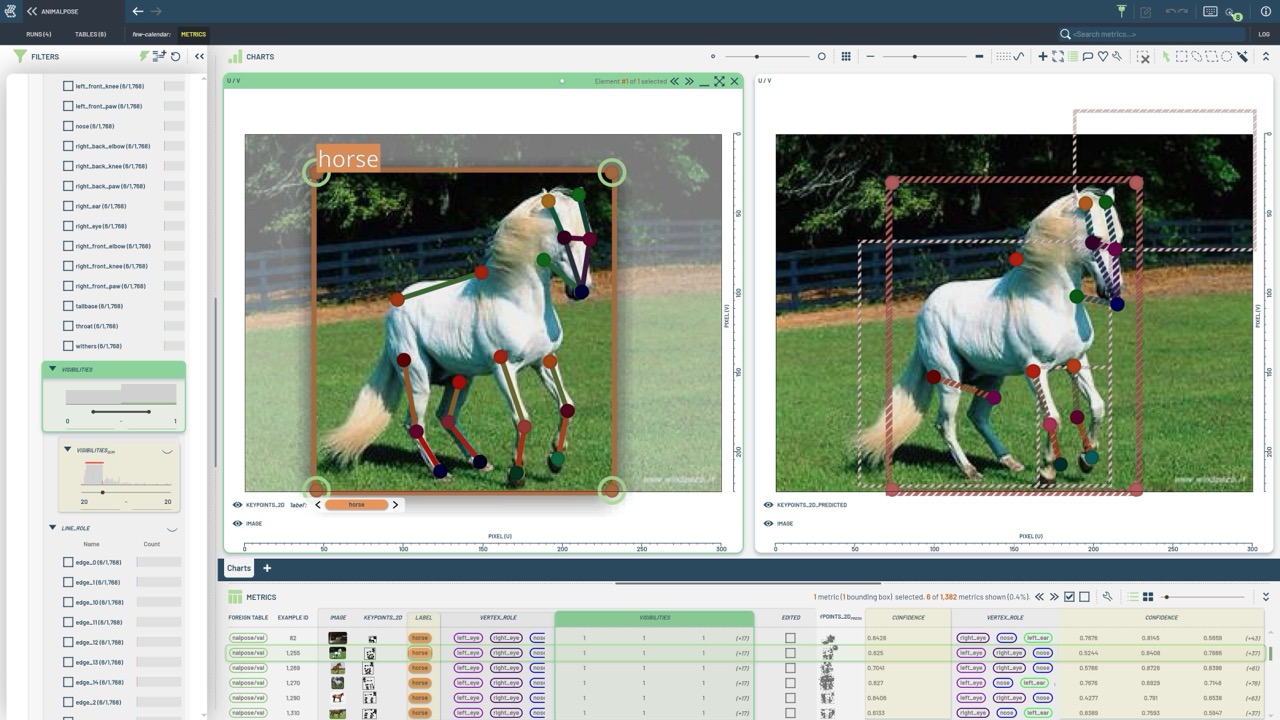
Point sets and skeletons for pose estimation.
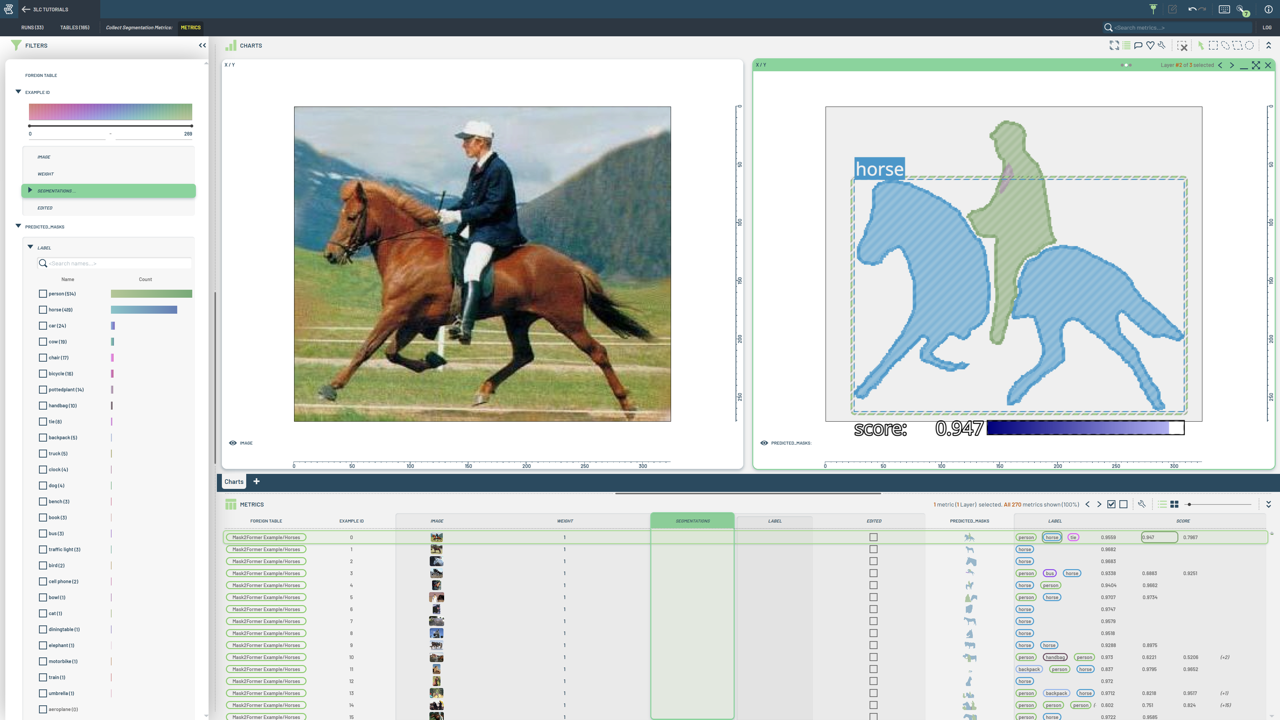
Per-instance masks and polygons.
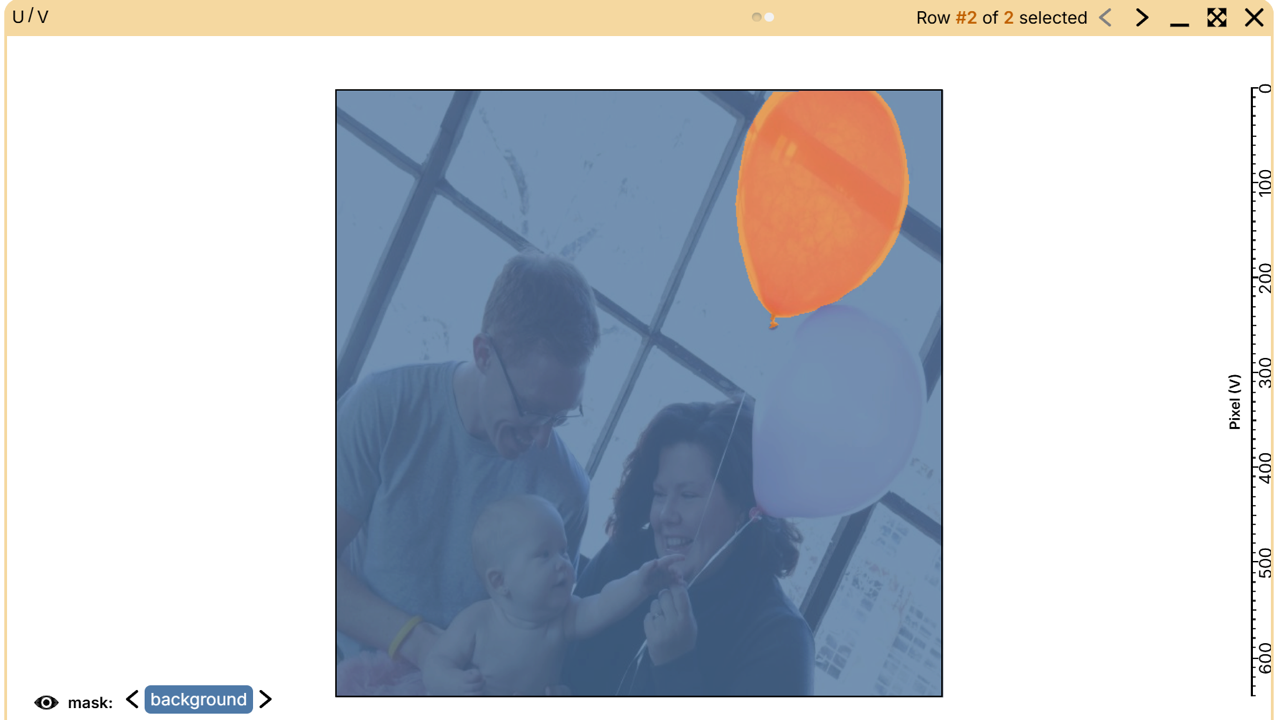
Dense per-pixel class maps stored as compact per-class RLE.
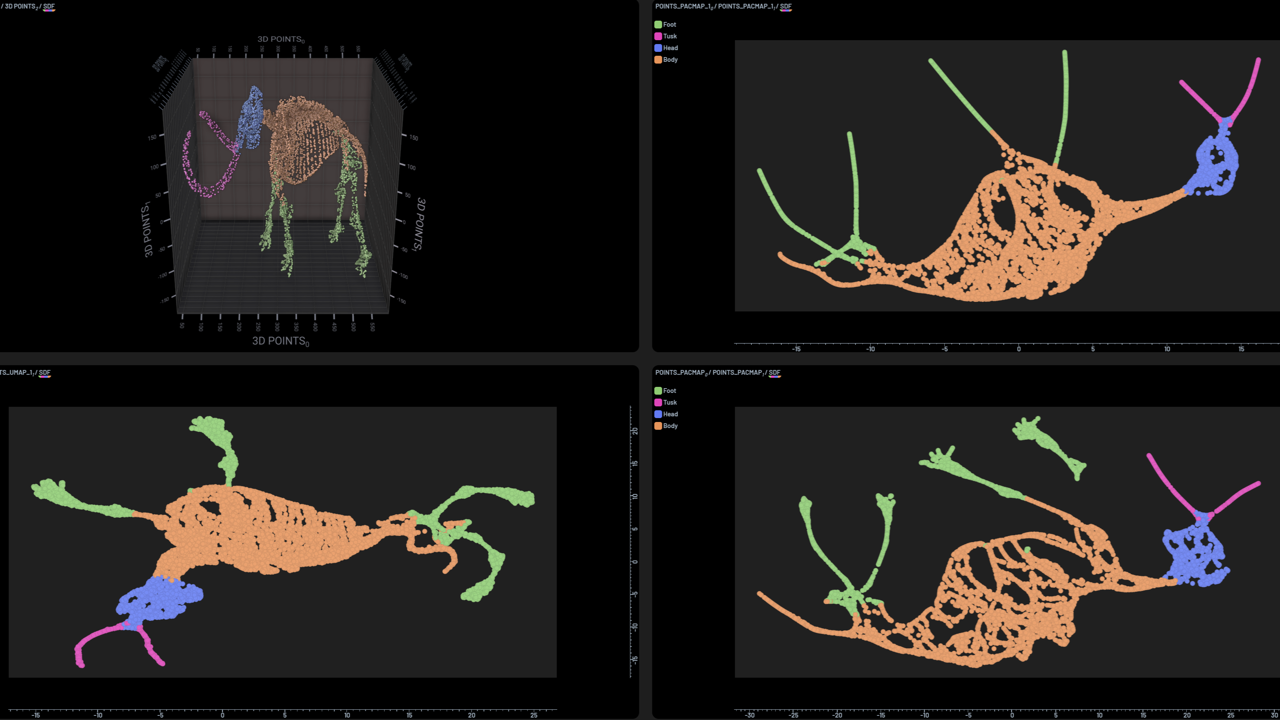
Neural network activations, dimensionality reduction, and visualization.
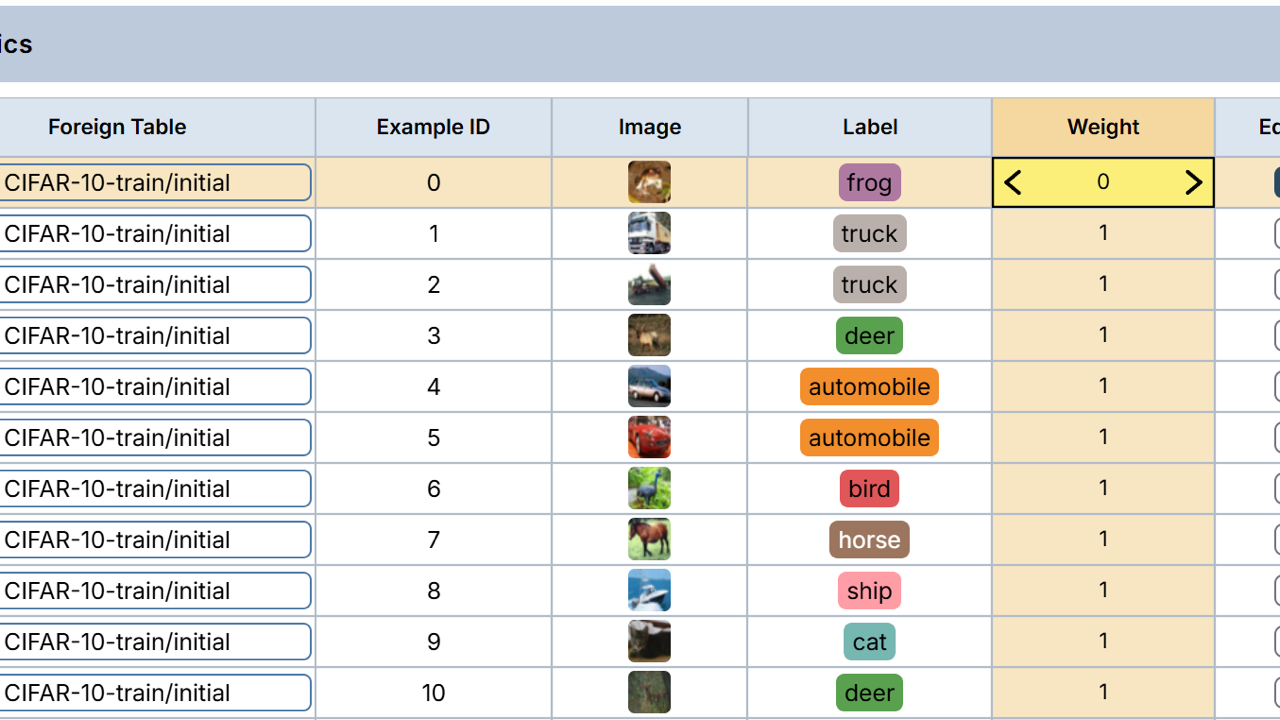
Per-sample importance for training and metrics collection.
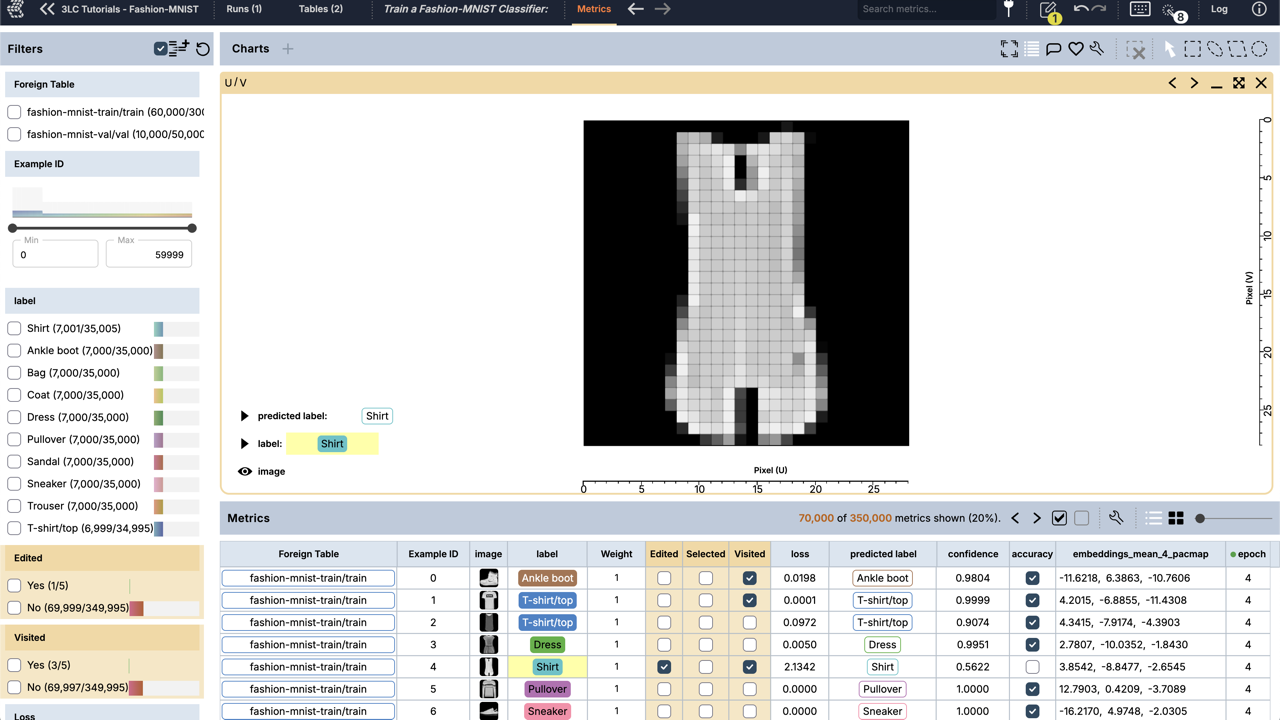
Temporary columns the Dashboard adds — edited, visited, and selected.